You are using an out of date browser. It may not display this or other websites correctly.
You should upgrade or use an alternative browser.
You should upgrade or use an alternative browser.
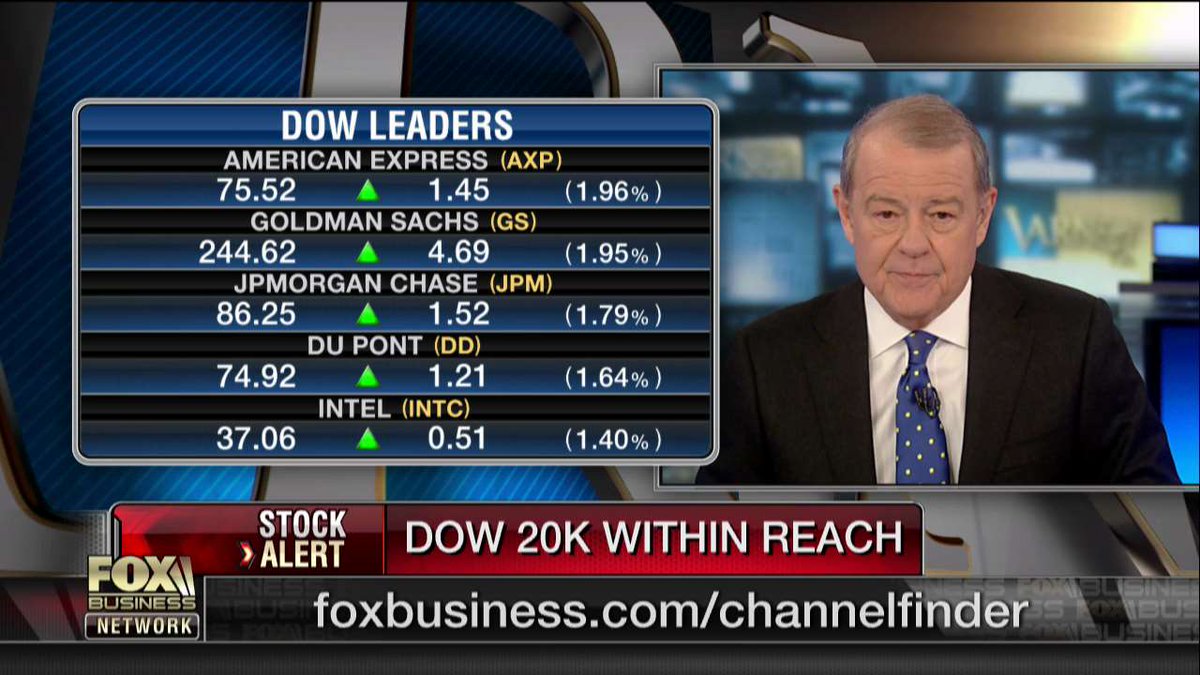
Dow at 17,000. What's more likely to happen first: it drops to 15,000 or continues to 20,000?
- Thread starter SECplayer
- Start date
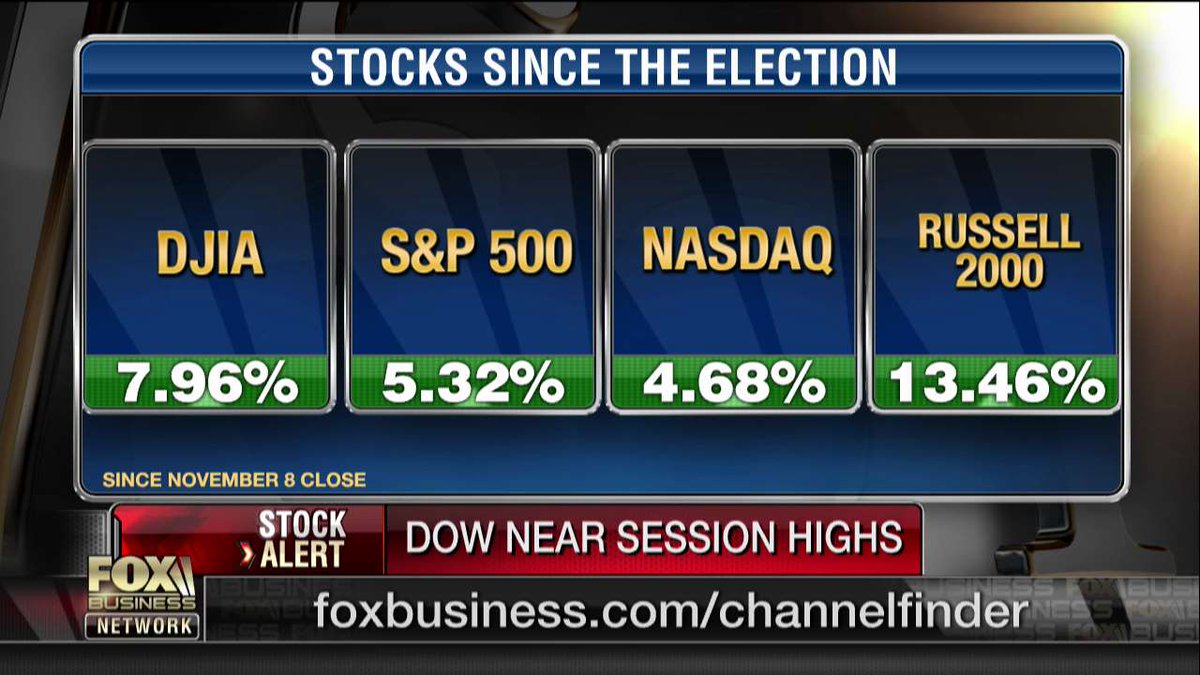

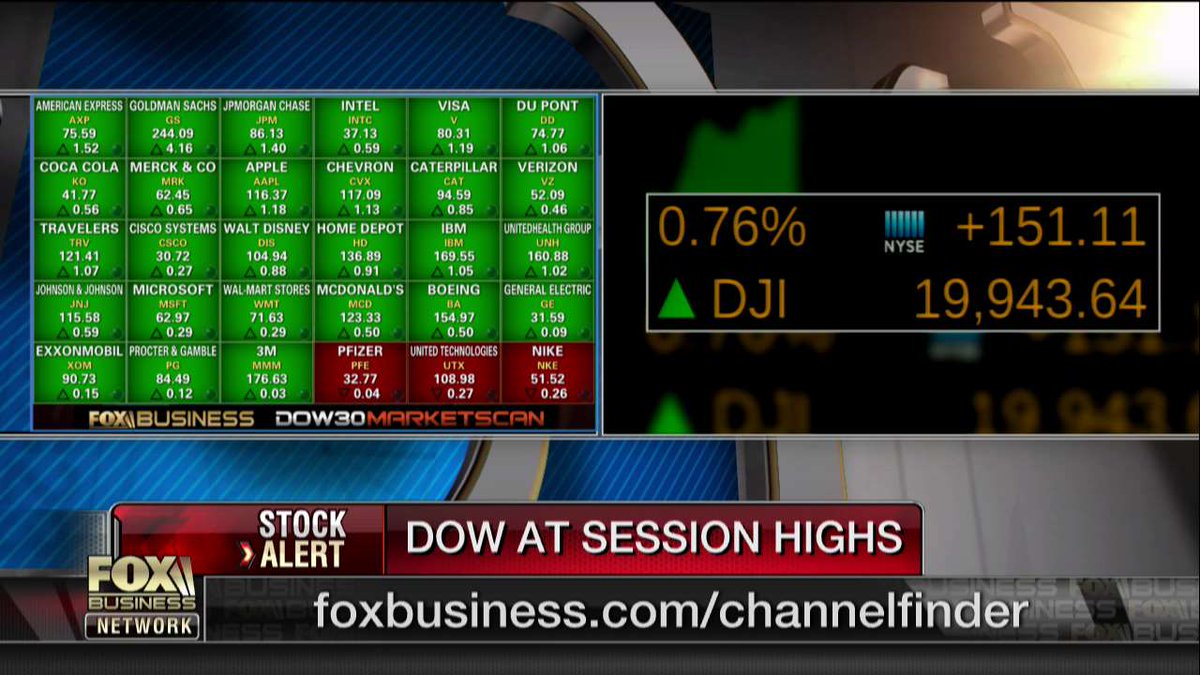
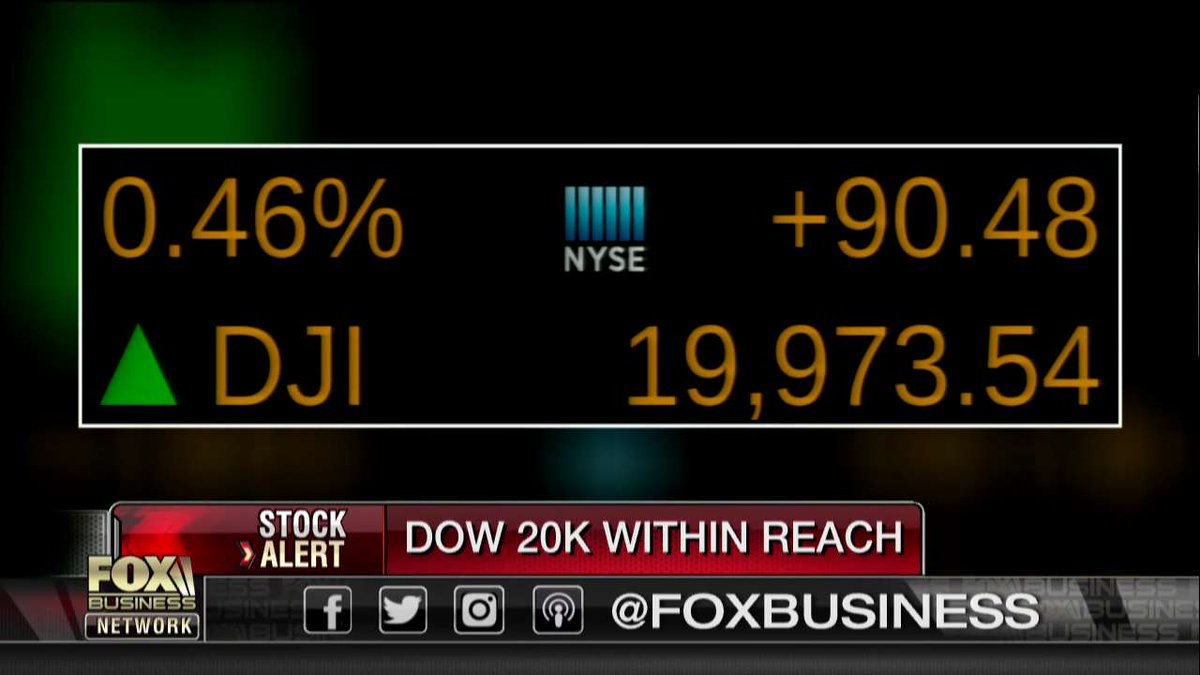
The Dow at session highs:
Was watching yesterday and for the past few days. Just trying to learn the DOW and the market. Any reason it started dropping yesterday afternoon after a long uphill run? Just wondering why? I too figured it would continue to rise but yet it did not.
What are your predictions for today?
I know I am a stocks newb just trying to learn...
predictions for today? I have none. Day to day predictions based on random thoughts in one's head ? That's a fool's game, crazy shit.
using tech analysis for entry/exit position of a stock/etf taken with a short/medium term horizon AND having a STRICT exit plan laid out, win or lose? game for that. Fun
candidly, i think there's TREMENDOUS value in tech analysis. Those with a long term horizon, obviously not as important-until they are getting close to needing the money (ex., retirement) . But those making short term - medium term horizon calls? HOW CAN YOU DO IT WITHOUT LOOKING AT A CHART? Let me give a specific example. BTW, all one needs is a basic , rudimentary understanding of candlestick charting-that's waht i have, nothin' more.........
back to my example. Let's say you were chatting with a friend. You both are convinced gold will go up as Mr Trump is being called the 'inflationary president-elect' and gold is the classic hedge agasint inflation. That's your position, sounds logical, now when to buy? JUST buy the fucker without looking at a chart? AT THE VERY LEAST the chart gives you guidance as to recent price/volume behaviour
now let's take a look at that chart;
your discussion with your friend its just after the election;
what did gold do? it dropped aggressively that's neither here or there . Now, as for an entry position. Look for support levels, price, volume-- remember its dropinig. first support was 1260-- did it hold that level? NO, would you buy as an entry position if it didnt hold a support level?of course not. So wait...next level of support from the chart? 1230-- FCUKIN HUGE level to hold, why? look at what's below!! a LARGE GAP to fill at a substantially lower level, and weak support levels!!!! Tremendous danger on the downside, your entry point could be much much better....that indeed has panned out. Now you and your friend saved a shit load. Where's support now?
the 3 year weekly
looks like 1125 (not strong)...then 1095 (not strong) .....then its TEN YEAR low, 1065ish..........
Isn't that mostly driven by tons of $ from China buying up property in and around the big Canadian cities? Thus debt exploding among native homebuyers.
I know Vancouver put a foreigner purchase tax on property to curb this but haven't read up on it lately.
NYC talked about doing the same but industry leaders killed it.
https://www.bloomberg.com/news/arti...-plummets-in-vancouver-after-new-property-tax
not an expert, but that's certainly one huge factor. Add silly low mortgage rates, cheap money, 'need to buy a house disease' and boom a disaster. In BC everyone was making money , geez, even the provincial govt ran a surplus and boosted about it, reveling in the insane flipping housing market that was FUELED BY GOVT policy. It appears shit has hit the fan and now govt is desperately trying to cool the market-- too late.
-nationally they have tightened mortage lending rules
- provincially, the province of BC as you stated added the foreigner tax rule. Ontario has not followed suit
Canada has a housing bubble, certainly in regions. And housing bubbles historically around the globe do not end well. In the US you guys can secure a rate at 30 years, correct? In Canada, not the case. And the term of mortgage chosen most often is 5 years. RATES are on the rise. The major banks have already started-- we are off. What happens in 5 yrs when homeowners term comes up? Because of silly household valuations, Canadians are at historical highs for household debt-- it seems to rise each quarter, lol....
http://www.theglobeandmail.com/repo...-debt-rises-in-third-quarter/article33318488/
Canadian household debt hit a record high in the third quarter, as the country’s love affair with low interest rates fuelled another round of heavy borrowing.
The ratio of debt to disposable income rose to 166.9 per cent from a revised 166.4 per cent in the second quarter, according to Statistics Canada’s national balance-sheet report released on Wednesday.
---------------
yet, the TSX is reaching an all-time high. Yeah, comical.
http://www.cbc.ca/news/business/bank-of-canada-financial-system-review-poloz-housing-1.3897875
[h=1]Bank of Canada warns about huge mortgages, growing housing debt[/h]
[h=3]Nearly half of new high ratio mortgagees in Toronto owe in excess of 450% of their incomes[/h]
NOW they are warning?......
as for China, don't they have a law that a citizen can only take out $50,000 out of the country? I heard many smuggle money to Hong Kong from there the three top destinations are:
USA
Australia
Canada
they are gobbling up world wide real estate.. Heard since Vcr implemented that tax law new destinations of choice are: seattle, calgary, toronto.
have a look at this site, lol:
https://list.juwai.com/
couple of headlines;
Chinese buyers broke records worldwide with their property-shopping spree last year
The China Market
From million-dollar trophy homes to more modest condominiums, Chinese buyers are the fastest-growing segment of global property buyers. By 2020, Chinese overseas property transactions are predicted to hit US$220 billion.
from that site;
[h=1]Property is investment of choice –
a stable investment exemplifying wealth & status[/h]
[h=4]70% pay cash for property purchases[/h]
[h=3]Motivations for Chinese global property investment[/h][FONT="]
[h=1]Property is investment of choice –
a stable investment exemplifying wealth & status[/h]
[h=4]70% pay cash for property purchases[/h]
[h=3]Motivations for Chinese global property investment[/h][FONT="]
[h=5]LIFESTYLE[/h]<svg width="120" height="120">
</path>
</path></svg>46%
[h=4]of the world’s[/h]luxury goods last year were bought by Chinese - 78% from overseas
[h=5]EMIGRATION[/h]<svg width="120" height="120">
</path>
</path></svg>64%
[h=4]of wealthy Chinese[/h]have or are seriously considering emigrating overseas
[h=5]INVESTMENT[/h]<svg width="120" height="120">
</path>
</path></svg>42%
[h=4]of China’s HNWIs[/h]intend to invest abroad in next 3 years - 66% who plan to buy residential properties
[h=5]EDUCATION[/h]<svg width="120" height="120">
</path>
</path></svg>83%
[h=4]of wealthy Chinese[/h]intend to educate their children overseas
[/FONT]</path>
</path></svg>46%
[h=4]of the world’s[/h]luxury goods last year were bought by Chinese - 78% from overseas
[h=5]EMIGRATION[/h]<svg width="120" height="120">
</path>
</path></svg>64%
[h=4]of wealthy Chinese[/h]have or are seriously considering emigrating overseas
[h=5]INVESTMENT[/h]<svg width="120" height="120">
</path>
</path></svg>42%
[h=4]of China’s HNWIs[/h]intend to invest abroad in next 3 years - 66% who plan to buy residential properties
[h=5]EDUCATION[/h]<svg width="120" height="120">
</path>
</path></svg>83%
[h=4]of wealthy Chinese[/h]intend to educate their children overseas
again, the precious metals CRUSHED recently...
SLV (silver)
3 month daily

insane MASSIVE gap 2 days ago......with the metals , high probability (that gap represents a 5% profit, massive!!) it gets filled. Waiting for a bullish end-of -day candlestick to enter/volume ......
2 year daily

definitely danger below as a gap and resistance level at 14.50.........this is on the radar.........................
the 10 year monthly

obviously high 13ish is a MASSIVE level
SLV (silver)
3 month daily
insane MASSIVE gap 2 days ago......with the metals , high probability (that gap represents a 5% profit, massive!!) it gets filled. Waiting for a bullish end-of -day candlestick to enter/volume ......
2 year daily
definitely danger below as a gap and resistance level at 14.50.........this is on the radar.........................
the 10 year monthly
obviously high 13ish is a MASSIVE level
food for thought...") . The author is in the financial industry, stands to benefit from market upside. Nonetheless......
. The author is in the financial industry, stands to benefit from market upside. Nonetheless......
.....................
The economic recovery since the Financial Crisis has been one of the weakest on record. Yes the labour market is doing quite well, housing is recovering nicely and stocks are trading at all-time highs. No complaints there. But overall economic growth has been subpar.
Going back to the 1950s, the U.S. economy has grown at an average of 3.3% annually and following recessions, typically grows at 5%+. Since 2010, the U.S. economy has grown at a lackluster 2.1%. But this looks set to change in 2017 as President-elect Trump is able to get some of his economic policies passed through congress providing a much needed boost to economy.
Leaving aside some of Trump’s more controversial policies (e.g., ripping up NAFTA, deporting immigrants, and banning Muslims from entering the U.S.), I believe some of his economic plans have real merit, and if passed, could help improve the trajectory of the U.S. economy, possibly boosting GDP growth to 3%+ over the next few years.
To show this we have to examine the four components of economic growth. In Economics 101, we learned that GDP = Consumption (C) + Government (G) + Investment (I) + Net Exports (X-M).
In recent years, consumption has been the main driver of economic growth for the U.S. economy. For example, over the last two years the U.S. economy has grown at an average rate of 1.90% (quarter-over-quarter annualized), with consumption contributing more than 100% to this growth (1.98% to be exact). Therefore, the other three areas (government spending, investment and net exports) actually detracted from economic growth.
I see personal consumption remaining healthy next year supported by an improving labour market, rising wages, stronger housing and equity markets, and high consumer confidence.
Where I see Trump’s policies having a positive impact is on government spending and investment.
On the government side, Trump’s trillion dollar infrastructure proposal could provide a strong boost to economic activity should it be passed. If we assume the trillion dollar infrastructure program is passed and the government spends $50 billion annually (his plan has the government and private sector each spending $500 billion over 10 years), I estimate that this could boost US GDP growth by 0.40% annually, assuming a multiplier of 1.5. The multiplier is an economic term which estimates the impact of government spending. Some studies show that infrastructure spending has a higher impact/multiplier than typical government spending, with some estimating the impact at 1.5 to even as high as 2 (i.e., infrastructure spending of $1 boosts the economy by $2). We think a more reasonable estimate is 1.5, which translates into a potential boost to growth of 0.40% annually.
On the investment side we see two specific policies possibly impacting economic growth. First is Trump’s plan to lower the corporate tax rate from 35% to 15%. Lower taxes paid by corporations will result in higher earnings and cash flow which could lead to increased investment from U.S. corporations.
More importantly is his proposal to reduce the tax rate on cash held overseas. It is estimated that over US$2 trillion in cash is stashed in overseas subsidiaries of U.S. corporations. Under the current tax regime if say, Apple, decides to repatriate those funds back to the U.S. it will have to pay Uncle Sam 35% first. Given this, many U.S. corporations have elected to keep those funds overseas to avoid paying these high taxes.
If Trump reduces that tax rate on these funds to say 15%, thus offering a “tax holiday” to U.S. companies, we could see a number of U.S. companies finally bring that cash back home, which could be used to increase dividends and stock buybacks, or better yet, increased investment which has a greater long-term economic impact.
Essentially, we see Trump’s policies providing a boost to government spending and investment which could push overall GDP growth above 3% in later 2017 and into 2018, a level not seen much during this recovery.
Now I’m going to get a bit geeky here so bear with me. If I’m correct on my economic growth expectations for 2017, then this has positive implications for corporate earnings and equity prices. Based on my economic model of S&P 500 revenues and U.S. GDP growth, if the U.S. economy grows at 3% on a real basis, then this implies a 7% growth rate for S&P 500 revenues in 2017. Applying a net income margin rate (net percentage companies earn after all expenses) of 9.5%, I estimate that S&P 500 earnings will rise to $117/share in 2017 or 9% year-over-year.
All of this supports our continued bullish view of the stock market, with stronger corporate earnings expected to drive equity prices higher in 2017. Finally, and to totally nerd out, based on my technical readings of the U.S. equity market, I’m projecting that the S&P 500 will rise to 2,400 in 2017 or 6.5% from current levels, coincidently the same as my fundamental target.
I always love it when my technical readings align with my fundamental projections. But then again, I don’t get out much!
. The author is in the financial industry, stands to benefit from market upside. Nonetheless...........................
The economic recovery since the Financial Crisis has been one of the weakest on record. Yes the labour market is doing quite well, housing is recovering nicely and stocks are trading at all-time highs. No complaints there. But overall economic growth has been subpar.
Going back to the 1950s, the U.S. economy has grown at an average of 3.3% annually and following recessions, typically grows at 5%+. Since 2010, the U.S. economy has grown at a lackluster 2.1%. But this looks set to change in 2017 as President-elect Trump is able to get some of his economic policies passed through congress providing a much needed boost to economy.
Leaving aside some of Trump’s more controversial policies (e.g., ripping up NAFTA, deporting immigrants, and banning Muslims from entering the U.S.), I believe some of his economic plans have real merit, and if passed, could help improve the trajectory of the U.S. economy, possibly boosting GDP growth to 3%+ over the next few years.
To show this we have to examine the four components of economic growth. In Economics 101, we learned that GDP = Consumption (C) + Government (G) + Investment (I) + Net Exports (X-M).
In recent years, consumption has been the main driver of economic growth for the U.S. economy. For example, over the last two years the U.S. economy has grown at an average rate of 1.90% (quarter-over-quarter annualized), with consumption contributing more than 100% to this growth (1.98% to be exact). Therefore, the other three areas (government spending, investment and net exports) actually detracted from economic growth.
I see personal consumption remaining healthy next year supported by an improving labour market, rising wages, stronger housing and equity markets, and high consumer confidence.
Where I see Trump’s policies having a positive impact is on government spending and investment.
On the government side, Trump’s trillion dollar infrastructure proposal could provide a strong boost to economic activity should it be passed. If we assume the trillion dollar infrastructure program is passed and the government spends $50 billion annually (his plan has the government and private sector each spending $500 billion over 10 years), I estimate that this could boost US GDP growth by 0.40% annually, assuming a multiplier of 1.5. The multiplier is an economic term which estimates the impact of government spending. Some studies show that infrastructure spending has a higher impact/multiplier than typical government spending, with some estimating the impact at 1.5 to even as high as 2 (i.e., infrastructure spending of $1 boosts the economy by $2). We think a more reasonable estimate is 1.5, which translates into a potential boost to growth of 0.40% annually.
On the investment side we see two specific policies possibly impacting economic growth. First is Trump’s plan to lower the corporate tax rate from 35% to 15%. Lower taxes paid by corporations will result in higher earnings and cash flow which could lead to increased investment from U.S. corporations.
More importantly is his proposal to reduce the tax rate on cash held overseas. It is estimated that over US$2 trillion in cash is stashed in overseas subsidiaries of U.S. corporations. Under the current tax regime if say, Apple, decides to repatriate those funds back to the U.S. it will have to pay Uncle Sam 35% first. Given this, many U.S. corporations have elected to keep those funds overseas to avoid paying these high taxes.
If Trump reduces that tax rate on these funds to say 15%, thus offering a “tax holiday” to U.S. companies, we could see a number of U.S. companies finally bring that cash back home, which could be used to increase dividends and stock buybacks, or better yet, increased investment which has a greater long-term economic impact.
Essentially, we see Trump’s policies providing a boost to government spending and investment which could push overall GDP growth above 3% in later 2017 and into 2018, a level not seen much during this recovery.
Now I’m going to get a bit geeky here so bear with me. If I’m correct on my economic growth expectations for 2017, then this has positive implications for corporate earnings and equity prices. Based on my economic model of S&P 500 revenues and U.S. GDP growth, if the U.S. economy grows at 3% on a real basis, then this implies a 7% growth rate for S&P 500 revenues in 2017. Applying a net income margin rate (net percentage companies earn after all expenses) of 9.5%, I estimate that S&P 500 earnings will rise to $117/share in 2017 or 9% year-over-year.
All of this supports our continued bullish view of the stock market, with stronger corporate earnings expected to drive equity prices higher in 2017. Finally, and to totally nerd out, based on my technical readings of the U.S. equity market, I’m projecting that the S&P 500 will rise to 2,400 in 2017 or 6.5% from current levels, coincidently the same as my fundamental target.
I always love it when my technical readings align with my fundamental projections. But then again, I don’t get out much!
As for the above article -- here's a classic example of where fundamental analysis gets silly . We have had a remarkable run-up in anticipation of potentially implemented Trump policies . He's not even yet in office .
this is why , personally , I'm never out of the market . Seemingly irrational behiavoir . Who can predict that with any level of confidence ?
this is why , personally , I'm never out of the market . Seemingly irrational behiavoir . Who can predict that with any level of confidence ?
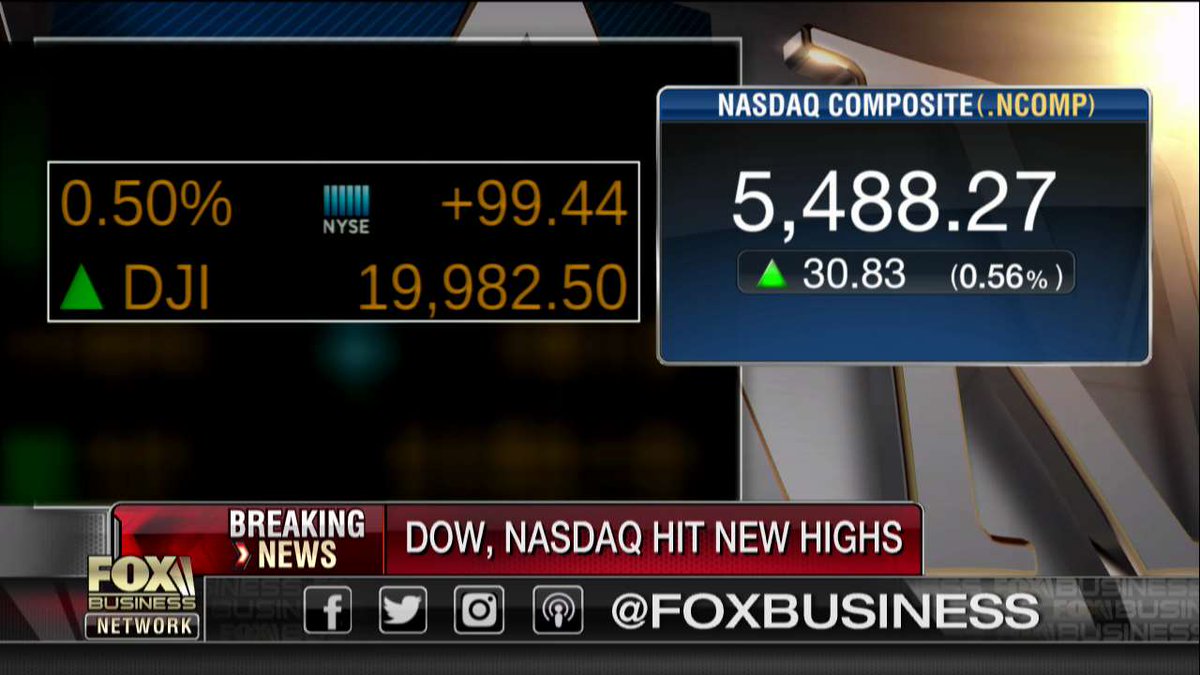
The Dow and Nasdaq hit new highs.
50k? lolas for China, don't they have a law that a citizen can only take out $50,000 out of the country? I heard many smuggle money to Hong Kong from there the three top destinations are:
USA
Australia
Canada
they are gobbling up world wide real estate.. Heard since Vcr implemented that tax law new destinations of choice are: seattle, calgary, toronto.
have a look at this site, lol:
https://list.juwai.com/
couple of headlines;
Chinese buyers broke records worldwide with their property-shopping spree last year
The China Market
From million-dollar trophy homes to more modest condominiums, Chinese buyers are the fastest-growing segment of global property buyers. By 2020, Chinese overseas property transactions are predicted to hit US$220 billion.
u have mainland chinese fucks buying homes without inspection and with straight cash in monterey park, alhambra, pasadena, arcadia, and san marino in california. their kids go to pasadena city college driving lambos and ferraris
So close yet so far.
Still trying
☰
Progressive Web App BETA
washingtonpost.com
© 1996-2016 The Washington Post
Business
Why this obsession with the Dow 20,000 is silly.
By Allan Sloan
January 5, 2017 at 3:05 PM
All eyes are on the Dow Jones industrial average.(Andrew Kelly/Reuters)
Today, let’s ignore journalistic convention and discuss something before it happens rather than waiting until afterward. What I’m talking about is the Dow hitting 20,000, something people have been awaiting for about a month now.
Under the conventions that govern such things, which I consider silly, we journalist types generally don’t write about the Dow hitting some landmark number until the Dow ends the day above it. For example, even though the Dow briefly hit five digits — a major landmark — on March 16, 1999, that wasn’t declared 10K day because the Dow ended the day in four-digit land. The Dow didn’t close above 10,000 until March 29, by which time the celebration felt as flat as champagne from a bottle that’s been open for almost two weeks.
So I’m writing about Dow 20K now before we all get buried in the endless articles, columns, blogs and whatnot that will inundate us when the Dow closes above that round but meaningless number.
Related: The Dow’s climb to 20,000? Whoop de doo.
Rather than discussing yet again why the Dow Jones industrial average — to give the Dow its full name — has virtually no financial significance while the far-lower-profile Standard & Poor’s 500-stock index is the one that really matters, let’s have some fun with numbers.
Let’s start with the perception—which I had shared until recently—that the performances of the Dow and the S&P don’t diverge all that much. I hear that a lot when I write that the Dow, a 120-year-old average based on stock prices, has only psychological importance, and that the indicator that really matters is the S&P 500, which is a 60-year-old index based on companies’ market values.
Lots of us, including me, own S&P index funds, so we have a rooting interest in how it performs. Virtually no one has a Dow index fund, although the Dow has vastly greater public mindshare than the S&P does.
In fact, the performance of the Dow and S&P aren’t all that far apart — but they’re far enough apart to make a difference, especially over a lengthy period.
According to the folks at S&P-Dow Jones Indices, which was formed in 2012 when the once-bitter rivals at S&P and Dow Jones combined, the Dow has risen by 6.3 percent a year, compounded, since the S&P assumed its current form in early 1957. The S&P has risen by 6.7 percent.
In both cases, we’re talking price only. We can’t compare the indicators’ total returns — price gains or losses plus reinvested dividends — because the Dow, launched in 1896 before computers existed, isn’t set up to handle total return calculations. That’s a major reason that the S&P rather than the Dow is considered a key performance benchmark by professional investors and has more than $2 trillion indexed to it, with almost nothing indexed to the Dow.
Those return numbers — 6.7 percent and 6.3 percent — don’t sound all that far apart, do they? But over time, the difference has been substantial. A hundred bucks set aside at year-end 1956 that earned the S&P rate would have been worth $4,797 at year-end 2016, compared with only $3,957 for the Dow.
Even though the Dow substantially outperformed the S&P last year, rising 13.4 percent compared to 9.5 percent, the S&P has outperformed the Dow in 33 of the 60 years covered by the numbers S&P-Dow Jones sent me.
In some years, the difference was even larger than last year’s. For instance, in 1979 and 1980, the S&P rose a total of 38.1 percent, compared to 19.1 percent for the Dow. The Dow way outperformed the S&P from 1999-2002, with its four-year returns totaling minus 4.9 percent, compared with a minus 27 percent total for the S&P.
A brief aside — I used to have a lot of fun getting the folks at S&P to badmouth the Dow, and the folks at Dow to badmouth the S&P. It’s the old journalistic game. But after Rupert Murdoch’s News Corp., which took over Dow Jones in 2007, sold 90 percent of DJ’s averages-indices business to the Chicago Mercantile Exchange’s parent for $607.5 million in 2010, the S&P-Dow Jones rivalry seemed to get less intense. And now, of course, the S&P and Dow Industrials have the same owner.
In 2013, Dow Jones sold the balance of its averages-indices business to the CME for $80 million. This means that Dow Jones no longer has any financial stake in the Dow average, although two people from Dow Jones’ Wall Street Journal sit on the committee that picks Dow components.
Whether stock prices rise or fall matters a lot, especially to those of us — including me — who have a substantial investment in stocks. But when the Dow happens to hit a round number like 20,000 is a fluke. As I’ve said several times, the Dow would have long since exceeded 20K had it not kicked out AT&T in 2015 make room for Apple. AT&T’s stock price has risen since then, and Apple’s has dropped.
So maybe the Dow will close above 20,000 one day this week, or maybe it won’t. Barring a big decline, we’ll see 20K Day sooner or later. Will Dow 20K matter? Not in the slightest. But it will sure be fun to watch the festivities.
again, the precious metals CRUSHED recently...
SLV (silver)
3 month daily
.....
insane MASSIVE gap 2 days ago......with the metals , high probability (that gap represents a 5% profit, massive!!) it gets filled. Waiting for a bullish end-of -day candlestick to enter/volume .
l
well, just never got an end of day bullish candlestick with affirming vol.Oh well...........................gap filled (massive 5%!!). Broke thru the 50 DMA, and now AT resistance. A break here and a clean sail to $16.75.


