I think you are right, I'm buying JD also
You are using an out of date browser. It may not display this or other websites correctly.
You should upgrade or use an alternative browser.
You should upgrade or use an alternative browser.
Intersting thoughts
- Thread starter Bozzie
- Start date

|
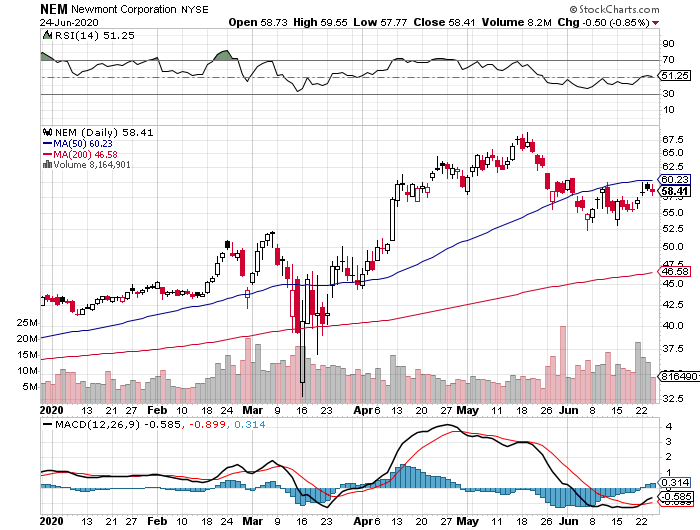
| Global Market Comments June 25, 2020 Fiat Lux Featured Trade: (5 REASONS GOLD IS GOING TO A NEW HIGH), (GLD), (GOLD), (NEM), (GDX) 
|
| � |
5 Reasons Gold is Going to a New High Gold has just broken out to a new nine-year high. And here’s the good news. It’s only just begun.Cut US dollar interest rates to zero and print $14 trillion more and you render the greenback worthless. Shunned as the pariah of the financial markets for years, the yellow metal has suddenly become everyone’s favorite hedge. Now that gold is back in fashion, how high can it really go? The question begs your rapt attention as the Coronavirus has suddenly unleashed a plethora of new positive fundamentals for the barbarous relic. It turns out that gold is THE deflationary asset to own. Who knew? I was an unmitigated bear on the price of gold after it peaked in 2011. In recent years, the world has been obsessed with yields, chasing them down to historically low levels across all asset classes. But now that much of the world already has, or is about to have negative interest rates, a bizarre new kind of mathematics applies to gold ownership. Gold’s problem used to be that it yielded absolutely nothing, cost you money to store, and carried hefty transaction costs. That asset class didn’t fit anywhere in a yield-obsessed universe. Now we have a horse of a different color. Europeans wishing to put money in a bank have to pay for the privilege to do so. Place €1 million on deposit on an overnight account, and you will have only 996,000 Euros in a year. You just lost 40 basis points on your -0.40% negative interest rate. With gold, you still earn zero, an extravagant return in this upside-down world. All of a sudden, zero is a win. For the first time in human history, that gives you a 40-basis point yield advantage by gold over Euros. Similar numbers now apply to Japanese yen deposits as well. As a result, the numbers are so compelling that it has sparked a new gold fever among hedge funds and European and Japanese individuals alike. Websites purveying investment-grade coins and bars crashed multiple times last week, due to overwhelming demand (I occasionally have the same problem). Some retailers have run out of stock. So I’ll take this opportunity to review a short history of the gold market (GLD) for the young and the uninformed. Since it last peaked in the summer of 2011 at $1,927 an ounce, the barbarous relic was beaten like the proverbial red-headed stepchild, dragging silver (SLV) down with it. It faced a perfect storm. Gold was traditionally sought after as an inflation hedge. But with economic growth weak, wages stagnant, and much work still being outsourced abroad, deflation became rampant. The biggest buyers of gold in the world, the Indians, have seen their purchasing power drop by half, thanks to the collapse of the rupee against the US dollar. The government increased taxes on gold in order to staunch precious capital outflows. Chart gold against the Shanghai index, and the similarity is striking, until negative interest rates became widespread in 2016. In the meantime, gold supply/demand balance was changing dramatically. While no one was looking, the average price of gold production soared from $5 in 1920 to $1,400 today. Over the last 100 years, the price of producing gold has risen four times faster than the underlying metal. It’s almost as if the gold mining industry is the only one in the world which sees real inflation since costs soared at a 15% annual rate for the past five years. This is a function of what I call “peak gold.” They’re not making it anymore. Miners are increasingly being driven to higher risk, more expensive parts of the world to find the stuff. You know those tires on heavy dump trucks? They now cost $200,000 each, and buyers face a three-year waiting list to buy one. Barrick Gold (GOLD), the world’s largest gold miner, didn’t try to mine gold at 15,000 feet in the Andes, where freezing water is a major problem, because they like the fresh air. What this means is that when the spot price of gold fell below the cost of production, miners simply shut down their most marginal facilities, drying up supply. That has recently been happening on a large scale. Barrick Gold, a client of the Mad Hedge Fund Trader, can still operate as older mines carry costs that go all the way down to $600 an ounce. No one is going to want to supply the sparkly stuff at a loss. So, supply disappeared. I am constantly barraged with emails from gold bugs who passionately argue that their beloved metal is trading at a tiny fraction of its true value and that the barbaric relic is really worth $5,000, $10,000, or even $50,000 an ounce (GLD). They claim the move in the yellow metal we are seeing now is only the beginning of a 30-fold rise in prices, similar to what we saw from 1972 to 1979 when it leaped from $32 to $950. So, when the chart below popped up in my inbox showing the gold backing of the US monetary base, I felt obligated to pass it on to you to illustrate one of the intellectual arguments these people are using. To match the gain seen since the 1936 monetary value peak of $35 an ounce, when the money supply was collapsing during the Great Depression and the double top in 1979 when gold futures first tickled $950, this precious metal has to increase in value by 800% from the recent $1,050 low. That would take our barbarous relic friend up to $8,400 an ounce. To match the move from the $35/ounce, 1972 low to the $950/ounce, 1979 top in absolute dollar terms, we need to see another 27.14 times move to $28,497/ounce. Have I gotten your attention yet? I am long term bullish on gold, other precious metals, and virtually all commodities for that matter. But I am not that bullish. These figures make my own $2,300/ounce long-term prediction positively wimp-like by comparison. The seven-year spike up in prices we saw in the seventies, which found me in a very long line in Johannesburg, South Africa to unload my own Krugerrands in 1979, was triggered by a number of one-off events that will never be repeated. Some 40 years of unrequited demand was unleashed when Richard Nixon took the US off the gold standard and decriminalized private ownership in 1972. Inflation then peaked around 20%. Newly enriched sellers of oil had a strong historical affinity with gold. South Africa, the world’s largest gold producer, was then a boycotted international pariah and teetering on the edge of disaster. We are nowhere near the same geopolitical neighborhood today, and hence, my more subdued forecast. But then again, I could be wrong. In the end, gold may have to wait for a return of real inflation to resume its push to new highs. The previous bear market in gold lasted 18 years, from 1980 to 1998, so don’t hold your breath. What should we look for? The surprise that your friends get an out-of-the-blue pay increase, the largest component of the inflation calculation. This is happening now in technology and is slowly tricking down to minimum wage workers. When I visit open houses in my neighborhood in San Francisco, half the visitors are thirty-somethings wearing hoodies offering to pay cash. It could be a long wait for real inflation, possibly into the mid-2020s when shocking wage hikes spread elsewhere. You may have noticed that I have been playing gold from the long side virtually every month since it bottomed in January. I’ll be back in there again, given a good low risk, high return entry point. You’ll be the first to know when that happens. As for the many investment advisor readers who have stayed long gold all along to hedge their clients' other risk assets, good for you. You’re finally learning! 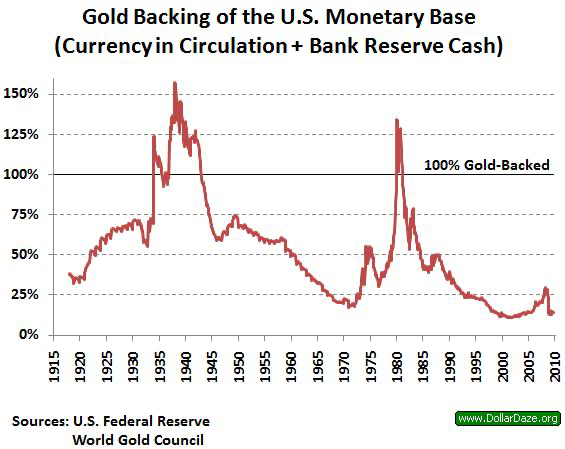

|
Quote of the Day “There is no vaccine for credit losses….bank provisions will be in the trillions,” said bank analyst Chris Whelan. 
|
One of the biggest IOPs of the year. 9.2 Billion
They fell short of the target 18 to 20 and will open it at 16.00
Smartmoney is the guy to ask about this one.
I will say a friends wife worked at Albertsons in management in Seattle and had nothing good to say about the way the company was run..I don't even know if it's the same team running the joint.
Not my thing but I'll be watching
good luck if you pull the trigger

|
| Global Market Comments June 26, 2020 Fiat Lux Featured Trade: (THEY’RE NOT MAKING AMERICANS ANYMORE), 
|
| � |
They're Not Making Americans Anymore You can count on a bear market hitting some time in 2038, one falling by at least 25%.Worse, there is almost a guarantee that a financial crisis, severe bear market, and possibly another Great Depression will take place no later than 2058 that would take the major indexes down by 50% or more. No, I have not taken to using an Ouija board, reading tea leaves, nor examine animal entrails in order to predict the future. It’s much easier than that. I simply read the data just released from the National Center for Health Statistics, a subsidiary of the federal Centers for Disease Control and Prevention (click here for their link). The government agency reported that the US birth rate fell to a new all-time low for the second year in a row, to 60.2 births per 1,000 women of child bearing age. A birth rate of 125 per 1,000 is necessary for a population to break even. The absolute number of births is the lowest since 1987. In 2017, women had 500,000 fewer babies than in 2007. These are the lowest number since WWII when 17 million men were away in the military, a crucial part of the equation. Babies grow up, at least most of them. In 20 years, they become consumers, earning wages, buying things, paying taxes, and generally contributing to economic growth. In 45 years, they do so quite substantially, becoming the major drivers of the economy. When these numbers fall, recessions and bear markets occur with absolute certainty. You have long heard me talk about the coming “Golden Age” of the 2020s. That’s when a two decade long demographic tailwind ensues because the number of “peak spenders’ in the economy starts to balloon to generational highs. The last time this happened during the 1980s and 1990s, stocks rose 20 fold. Right now we are just coming out of two decades of demographic headwind, when the number of big spenders in the economy reached a low ebb. This was the cause of the Great Recession, the stock market crash and the anemic 2% annual growth since then. The reasons for the maternity ward slowdown are many. The great recession certainly blew a hole in the family plans of many Millennials. Falling incomes always lead to lower birth rates, with many Millennial couples delaying children by five years or more. Millennial mothers are now having children later than at any time in history. Burgeoning student debt, which just topped $1.5 trillion, is another. Many prospective mothers would rather get out from under substantial debt before they add to the population. The rising education of women is another drag on child bearing and is a global trend. When spouses become serious wage earners, families inevitably shrink. Husbands would rather take the money and improve their lifestyles than have more kids to feed. Women are also delaying having children to postpone the “pay gaps” that always kick in after they take maternity leave. Many are pegging income targets before they entertain starting families. As a result of these trends, one in five children last year were born to women over the age of 35, a new high. This is how Latin Americans moved from eight to two-child families in only one generation. The same is about to take place in Africa, where standards of living are rising rapidly, thanks to the eradication of several serious diseases. The sharpest falls in the US have been with minorities. Since 2017, the birthrates for Hispanics has dropped by 27% from a very high level, African Americans 11%, whites 5%, and Asian 4%. Europe has long had the same problem with plunging growth rates but only much worse. Historically, the US has made up for the shortfall with immigration, but that is now falling, thanks to the current administration policies. Restricting immigration now is a guaranty of slowing economic growth in the future. It’s just a numbers game. So watch that growth rate. When it starts to tick up again, it’s time to buy….in about 20 years. I’ll be there to remind you with this newsletter. As for me, I’ve been doing my part. I have five kids aged 15-34, and my life is only half over. Where did you say they keep the Pampers? 
|
Quote of the Day “It’s easier to get out of Cuba than to get out of Facebook,” said a market analyst. 
|
Albertson's is a sucker stock. Stock issuance to existing shareholders with NO debt paydown.
Albertson's debt load is too high for a small margin business.
Albertson's which is net on net a negative history of too much acquisition.... paying a huge premium for the former Safeway Stores..... and having failed to materially pay down debt.
The equity owners of Albertson's are bailing out.. selling as many shares as they can.... a lot less than they wanted to at a much lower price. I believe they had to reduce shares for sale by 20% AND drop price by 20% and they are all in.
Assuming they no more about the investment they have owned over the past many years and assuming timing has to do with extraordinary grocery profits relating to hoarding and a virus crisis.... they are dumping their shares and shareholders in time will realize they are going to be bag holders in this one.
Any interest in Albertson's (ACI) IPO tomorrow?
Grocery biz is right up my alley (GF runs the finance team of a huge chain (Top 5)). I'm poor as shit, though, ask smf...
They can have this one, we aren't touching it, although we have considered a move to Boise for work as Albertson's would love to have us, but we'll pass on that as well...
They can have this one, we aren't touching it, although we have considered a move to Boise for work as Albertson's would love to have us, but we'll pass on that as well...
SMF?
Yeah. Albertsons looks like garbage.
Boise isn't as great as it's billed.. Strip malls and shit ugly construction going up everywhere
Unchecked development..traffic..Not a fan.
Yeah. Albertsons looks like garbage.
Boise isn't as great as it's billed.. Strip malls and shit ugly construction going up everywhere
Unchecked development..traffic..Not a fan.
Grocery biz is right up my alley (GF runs the finance team of a huge chain (Top 5)). I'm poor as shit, though, ask smf...
They can have this one, we aren't touching it, although we have considered a move to Boise for work as Albertson's would love to have us, but we'll pass on that as well...
SMF?
Yeah. Albertsons looks like garbage.
Boise isn't as great as it's billed.. Strip malls and shit ugly construction going up everywhere
Unchecked development..traffic..Not a fan.
I was a fan 10-15 years ago, now it's been taken over by the such that you state. No thanks, if I'm moving to place like Idaho, or anywhere for the matter, it's gotta be rural, and Boise has lost that, and the cost of living has skyrocketed, so it's a pass forever ever...
SMF is your buddy posting above, the only buddy that racist loser has here, but it's all good. I just want to see us all make money, not everyone become poor and die...
Good luck on future plays, we have been killing it fo sho...
Ahhh..Agree, lets all make some money.
Real opportunity is just around the corner in the market.
I've been very bearish to my own detriment... hopefully it pays off here shortly.
Real opportunity is just around the corner in the market.
I've been very bearish to my own detriment... hopefully it pays off here shortly.
I was a fan 10-15 years ago, now it's been taken over by the such that you state. No thanks, if I'm moving to place like Idaho, or anywhere for the matter, it's gotta be rural, and Boise has lost that, and the cost of living has skyrocketed, so it's a pass forever ever...
SMF is your buddy posting above, the only buddy that racist loser has here, but it's all good. I just want to see us all make money, not everyone become poor and die...
Good luck on future plays, we have been killing it fo sho...

Global Market Comments
June 29, 2020
Fiat LuxFeatured Trade:(MARKET OUTLOOK FOR THE WEEK AHEAD, or COVID-19 IS BACK!)
(SPX), (TLT), (TBT), (TSLA), (BAC),
(XOM), (CCL), (MGM), (WYNN), (UAL)

June 29, 2020
Fiat LuxFeatured Trade:(MARKET OUTLOOK FOR THE WEEK AHEAD, or COVID-19 IS BACK!)
(SPX), (TLT), (TBT), (TSLA), (BAC),
(XOM), (CCL), (MGM), (WYNN), (UAL)

The Market Outlook for the Week Ahead, or Covid-19 is Back!
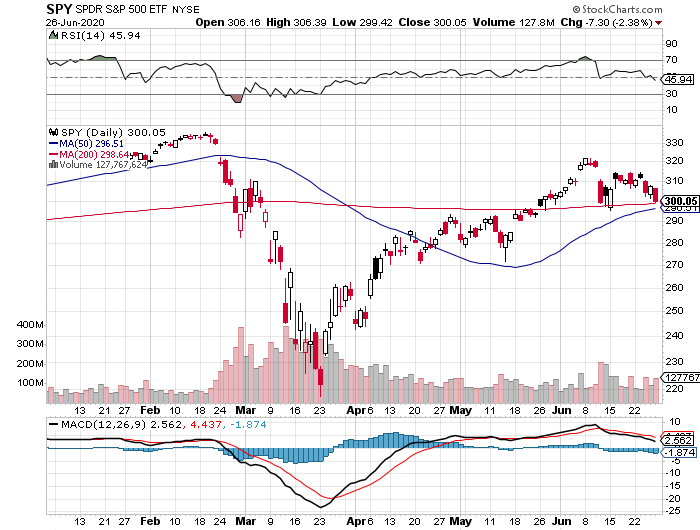
This was the week that the Coronavirus came back with a vengeance.The market had been backing out the pandemic for the past three months. Now it is abruptly pricing it back in.
Hospitalizations soared in 16 states to new all-time highs, as the first wave continues to grow exponentially. Deaths have topped 125,000. The good news is that only 5,000 died last week. That is nearly two 9/11’s, or 12 Boeing 747’s crashes worth of victims.
Apple has closed eight stores in Texas and another 14 stores in Florida. Arizona is on the verge of running out of hospital beds. This is going to weigh heavily on the market until we see another interim peak. It looks like the last one was certainly a false summit, in climber’s lingo.
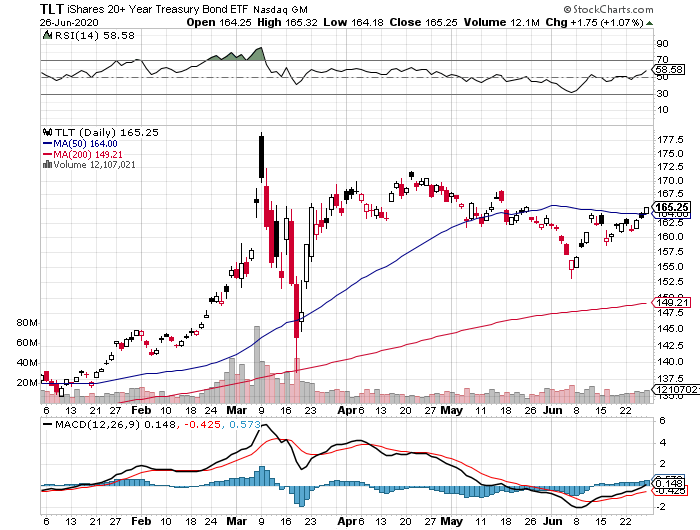
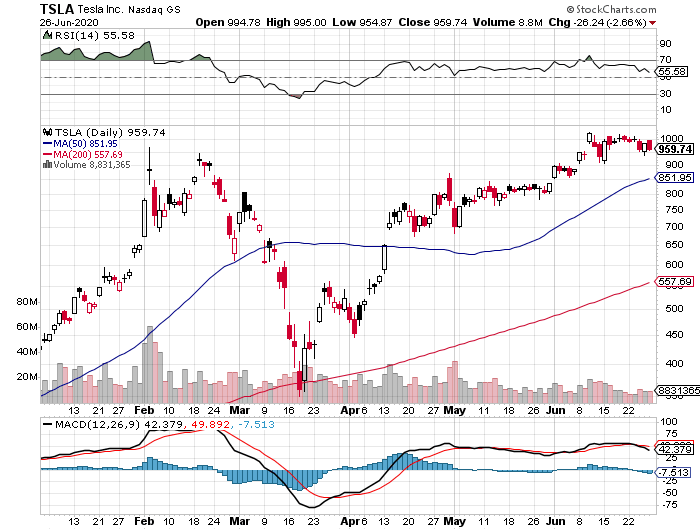
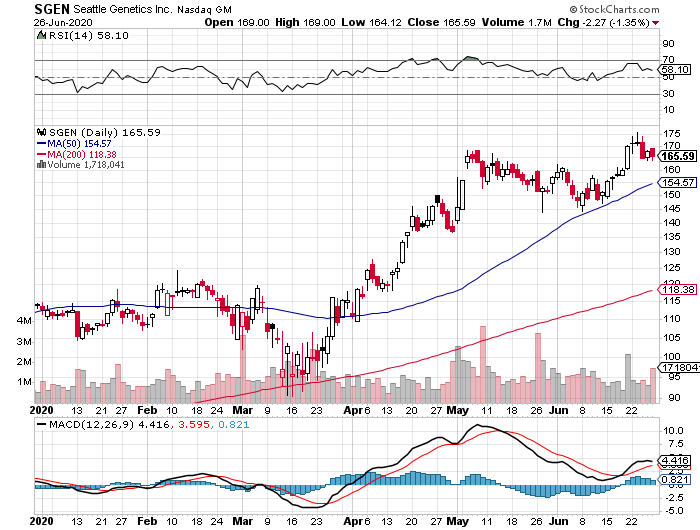
What was really interesting last week is what DIDN’T happen. While the “reopening” stock LIKE banks (BAC), energy (XOM), cruise lines (CCL), hotels (MGM), casinos (WYNN), airlines (UAL) were absolutely slaughtered, gold, technology, and biotech barely moved. It says volumes about what happens next. You want to use selloffs to buy quality at a discount, not garbage that is going to zero.
Technology and biotech are where you want to focus your buying of stock, futures, and LEAPS. The next big dip is the one you buy.
You can count on the government stepping in and announcing more stimulus on the next down 1,000-point day. Thursday mornings seem to be a favorite time, right before the next horrific Weekly Jobless Claims are announced, which also seem to be reaccelerating.
The Fed can do this for free, without spending any money, simply by expanding the asset classes eligible for quantitative easing. Some $8 trillion in QE certainly buys a lot of friends in the market. I believe that any run in the S&P 500 (SPX) down to 2,700 will be met by government action.
Treasury Secretary Steve Mnuchin expects another stimulus package in July, but only if he gives away the store to Nancy Pelosi. Just what the market needs, more stimulus. Most of the 40 million out of work are still jobless. It could be $1 trillion worth of stimulus checks and other giveaways headed for the stock market, like the last lot. My kids still haven’t spent their first checks! We’re going broke anyway, so why not?
The stock market is clearly running out of gas, at a 26 multiple, the highest since the Dotcom bubble top. Any more stimulus may simply go into bank deposits. The risk/reward for new positions here is terrible. It sits nicely into my sideways range scenario for the rest of the year.
Existing Home Sales are down 9.7% in May, the worst in ten years. They are off 26.6% YOY, the worst figure since 1982 when home mortgage rates were at 18%. Inventories are down an eye-popping 18.8% to 4.8 months as sellers pulled listing to avoid virus-infested buyers. The first-time buyers live, but the action is shifting out of condos and into single family homes in the burbs.
Weekly Jobless Claims jump 1.5 million, far worse than forecast. It looks like we are getting a second wave of jobless as Corona ravages the south and business hangers-on throw in the towel. Some 20 million Americans remain on state unemployment benefits, which will start to run out shortly. Will stocks look through this?
Banks are banned from paying dividends and buying back shares, orders the US Treasury. The Fed estimates that pandemic-related loan losses could reach $700 billion, wiping out their capital. Every bailout comes with a pound of flesh. The banks have made billions off of stimulus loans, like the PPP. The banks rallied because the news wasn’t worse, like a mandatory 5% share giveaway, which happened last time. Buy banks like (JPM), (BAC), and (C) on an expected yield curve steepening.
Tesla (TSLA) is now the world’s most valuable car company, with a market capitalization of over $180 billion. It just passed Toyota Motors (TM). (TSLA) is now worth more than the entire US car industry combined. That could double very quickly. The upcoming model Y is expected to be its biggest seller and a third production plant will be announced imminently. The rush out of public transit and into private cars simply accelerated a pre-existing trend or the company.
When we come out on the other side of this, we will be perfectly poised to launch into my new American Golden Age, or the next Roaring Twenties. With interest rates still at zero, oil cheap, there will be no reason not to. The Dow Average will rise by 400% or more in the coming decade.
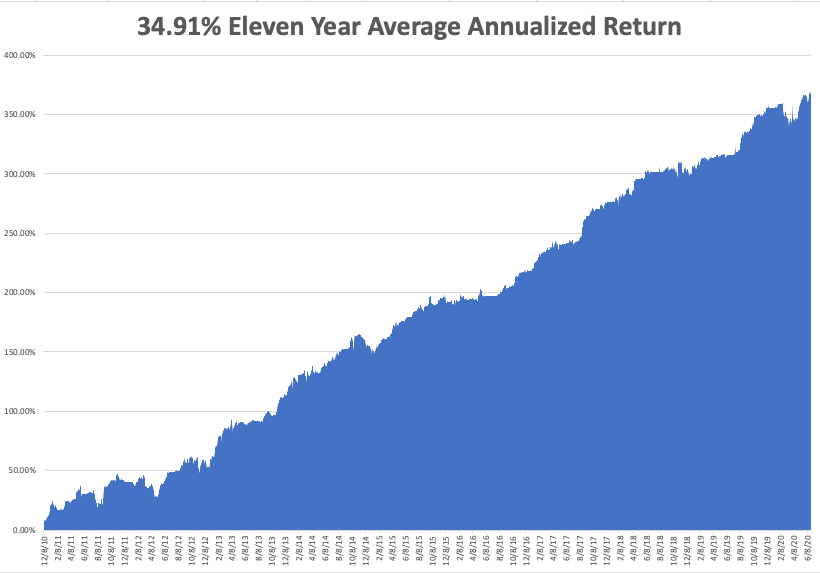
My Global Trading Dispatch enjoyed another respectable week, taking in a welcome 3.87%, bringing June in at +2.56%. Despite the market diving nearly 10%, we pulled in big profits from our short positions and captured accelerated time decay on our longs. My eleven-year performance stands at a new all-time high of 368.75%.
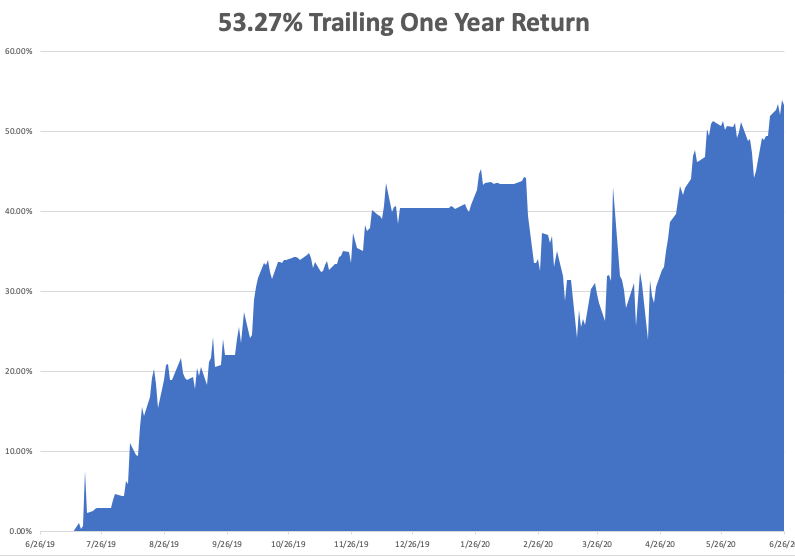
That takes my 2020 YTD return up to a more robust +12.88%. This compares to a loss for the Dow Average of -12.3%, up from -37% on March 23. My trailing one-year return popped back up to 53.27%. My eleven-year average annualized profit recovered to +34.91%.
The only numbers that count for the market are the number of US Coronavirus cases and deaths, which you can find here. It’s jobs week and we should see an onslaught of truly awful numbers.
On Monday, June 29 at 11:00 AM EST, US Pending Home Sales for May are out.
On Tuesday, June 30 at 10:00 AM EST, the April Case-Shiller National Home Price Index is published.
On Wednesday, July 1, at 9:15 AM EST, the ADP Private Employment Report is released. At 10:30 AM EST, the EIA Cushing Crude Oil Stocks are published.
On Thursday, June 2 at 8:30 AM EST, Weekly Jobless Claims are announced.
On Friday, June 3, at 8:30 AM EST, the June Nonfarm Payroll Report is printed. Since last month was a large overstatement, June could be positively diabolical. The Baker Hughes Rig Count is out at 2:00 PM EST.
As for me, I am rushing out and doing errands, like a trip to the barber, haircut, hardware store, dry cleaners, the dentist, and the doctor in case the California economy shuts down once again. We’ve been slightly open for a few weeks.
That may be all we get this year.
Stay healthy.
John Thomas
CEO & Publisher
The Diary of a Mad Hedge Fund Trader


Quote of the Day
"Everything is expensive now. Worries about the future can cause safe assets to become highly-priced...I call it the 'Titanic Effect.' When the Titanic was going down, people would pay a fortune for anything that floats. We may be in a Titanic situation now," said my buddy, Nobel Prize winner Robert Shiller.

Thank you Bozzi, I had no idea such an instrument existed, now I have to do my research
No problem..I like SQQQ the market cap vs GDP situation in the market and w/earnings coming up..Ouch.
Five Things
Five Things You Need to Know to Start Your Day
By Lorcan Roche Kelly
June 30, 2020, 3:36 AM PDT
[h=2]SHARE THIS ARTICLE[/h]
Share
Tweet
Post
Email
[h=2]In this article[/h]SPX
S&P 500
3,053.24
USD
+44.19+1.47%
0751538D
WORLD HEALTH ORGANIZATION
Private Company
CL1
WTI Crude
38.96
USD/bbl.
-0.74-1.86%
FDX
FEDEX CORP
134.55
USD
+4.47+3.44%
Powell warns of extraordinary uncertainty, WHO warns the worst is yet to come, and U.S. starts to roll back Hong Kong's special status.
[h=2]Uncertain[/h]Federal Reserve Chairman Jerome Powell will warn the path forward for the U.S. economy is "extraordinarily uncertain" in his prepared remarks for testimony before the House Financial Services Committee from 12:30 p.m. Eastern Time. Treasury Secretary Steven Mnuchin will join Powell in the House to discuss the fiscal and monetary response to the pandemic shutdown. Powell will make clear that the government measures to provide relief would need to remain in place "for as long as needed."
[h=2]Going to get worse[/h]The World Health Organization warned that the world is far from seeing the end of the pandemic, saying the worst is yet to come. In the U.S. more states took steps to scale back reopenings with Arizona closing bars and New Jersey halting plans for indoor dining. Australia imposed a four-week lockdown across parts of Melbourne, while in Iran 10,000 health-care workers have contracted the virus. The German infection rate remained below the key 1.0 threshold, while in the U.K. Prime Minister Boris Johnson will commit to infrastructure spending in an effort to rebuild the virus-ravaged economy.
Sponsored Content by Manscaped
Last year there were 171,321 reported ER visits related to personal grooming injuries. Fortunately, MANSCAPED engineered the first manscaping trimmer with SkinSafe™ technology!
See Why Shark Tank went all in on MANSCAPED.
Use code BLOOMBERG for 20% OFF and Free Shipping at Manscaped.com.
[h=2]Hong Kong[/h]China’s top legislative body approved a landmark national security law for Hong Kong in a unanimous vote this morning. The Trump administration yesterday escalated pressure on Beijing when it ended some special treatments for Hong Kong regarding the export of sensitive technology. The U.K. said the passage of the law is a "grave step" amid fears that the former British colony's status as an international commercial hub could come under more pressure.
[h=2]Markets mixed[/h]It's the last trading day of what has been a very eventful first half of the year and stocks are not doing very much at all. Overnight the MSCI Asia Pacific Index added 0.6% while Japan's Topix index closed 0.6% higher. In Europe, the Stoxx 600 Index was 0.2% lower at 5:50 a.m. in a session that has seen the gauge fluctuate between gains and losses. S&P 500 futures were pointing to a small drop at the open, the 10-year Treasury yield was at 0.633% and oil slipped.
[h=2]Coming up...[/h]Democrat lawmakers will go to the White House this morning for a briefing on reports that Russian operatives in Afghanistan offered bounties for the killing of American soldiers. S&P CoreLogic U.S. house prices for April is published at 9:00 a.m., with Chicago PMI for June at 9:45 a.m. As well as Powell, we will also hear today from New York Fed President John Williams, Fed Governor Lael Brainard, Minneapolis Fed President Neel Kashkari and Atlanta Fed President Raphael Bostic. Dr. Anthony Fauci testifies before the Senate Health and Education Committee. FedEx Corp. reports results and SpaceX is scheduled to launch a Falcon 9 rocket.
[h=2]What we've been reading[/h]This is what's caught our eye over the last 24 hours.

But it turns out this isn't a V at all. The key reason is that these regional Fed surveys, or PMIs, or ISMs (they're all similar) aren't measuring some absolute level of activity. They're measuring how the panelists' businesses are doing relative to the month before. So you'll notice that the Dallas Fed chart above shows a reading of -6.1. Because it's below 0 that means respondents on net actually said business was worse than it was in the prior month.
Here's the same data as above, but presented as a bar chart, which makes the situation even more clear. As you can see, manufacturers in Texas have now reported four straight months of the situation being worse than it was in the month before. Yes, the pace at which it's getting worse is less severe, but it's still a sequential deterioration.
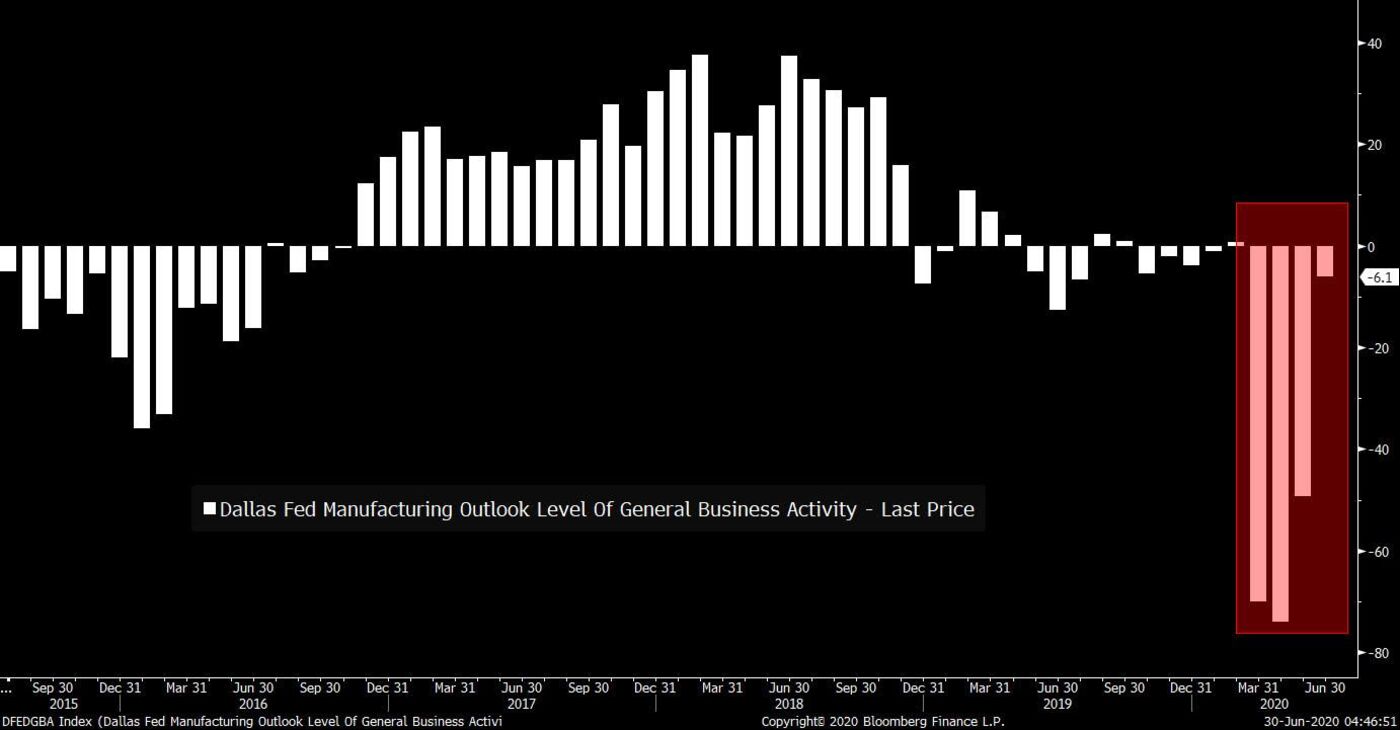
Anyway, all you have to do is take one look at the actual survey, and you'll see there's no V. The employment situation is getting worse. More manufacturers are still laying off workers than expanding payrolls. Only 29% of survey respondents see a better economic future than they saw the previous month. Business uncertainty is still growing. And if you read the anecdotal comments, there's already some talk from companies about how the latest rise in Texas virus cases is an economic concern. Bottom line: there are a lot of charts that look like a V, but in reality they don't show anything close to a snapback to normal.
Five Things
Five Things You Need to Know to Start Your Day
By Lorcan Roche Kelly
June 30, 2020, 3:36 AM PDT
[h=2]SHARE THIS ARTICLE[/h]
Share
Tweet
Post
[h=2]In this article[/h]SPX
S&P 500
3,053.24
USD
+44.19+1.47%
0751538D
WORLD HEALTH ORGANIZATION
Private Company
CL1
WTI Crude
38.96
USD/bbl.
-0.74-1.86%
FDX
FEDEX CORP
134.55
USD
+4.47+3.44%
Powell warns of extraordinary uncertainty, WHO warns the worst is yet to come, and U.S. starts to roll back Hong Kong's special status.
[h=2]Uncertain[/h]Federal Reserve Chairman Jerome Powell will warn the path forward for the U.S. economy is "extraordinarily uncertain" in his prepared remarks for testimony before the House Financial Services Committee from 12:30 p.m. Eastern Time. Treasury Secretary Steven Mnuchin will join Powell in the House to discuss the fiscal and monetary response to the pandemic shutdown. Powell will make clear that the government measures to provide relief would need to remain in place "for as long as needed."
[h=2]Going to get worse[/h]The World Health Organization warned that the world is far from seeing the end of the pandemic, saying the worst is yet to come. In the U.S. more states took steps to scale back reopenings with Arizona closing bars and New Jersey halting plans for indoor dining. Australia imposed a four-week lockdown across parts of Melbourne, while in Iran 10,000 health-care workers have contracted the virus. The German infection rate remained below the key 1.0 threshold, while in the U.K. Prime Minister Boris Johnson will commit to infrastructure spending in an effort to rebuild the virus-ravaged economy.
Sponsored Content by Manscaped
Last year there were 171,321 reported ER visits related to personal grooming injuries. Fortunately, MANSCAPED engineered the first manscaping trimmer with SkinSafe™ technology!
See Why Shark Tank went all in on MANSCAPED.
Use code BLOOMBERG for 20% OFF and Free Shipping at Manscaped.com.
[h=2]Hong Kong[/h]China’s top legislative body approved a landmark national security law for Hong Kong in a unanimous vote this morning. The Trump administration yesterday escalated pressure on Beijing when it ended some special treatments for Hong Kong regarding the export of sensitive technology. The U.K. said the passage of the law is a "grave step" amid fears that the former British colony's status as an international commercial hub could come under more pressure.
[h=2]Markets mixed[/h]It's the last trading day of what has been a very eventful first half of the year and stocks are not doing very much at all. Overnight the MSCI Asia Pacific Index added 0.6% while Japan's Topix index closed 0.6% higher. In Europe, the Stoxx 600 Index was 0.2% lower at 5:50 a.m. in a session that has seen the gauge fluctuate between gains and losses. S&P 500 futures were pointing to a small drop at the open, the 10-year Treasury yield was at 0.633% and oil slipped.
[h=2]Coming up...[/h]Democrat lawmakers will go to the White House this morning for a briefing on reports that Russian operatives in Afghanistan offered bounties for the killing of American soldiers. S&P CoreLogic U.S. house prices for April is published at 9:00 a.m., with Chicago PMI for June at 9:45 a.m. As well as Powell, we will also hear today from New York Fed President John Williams, Fed Governor Lael Brainard, Minneapolis Fed President Neel Kashkari and Atlanta Fed President Raphael Bostic. Dr. Anthony Fauci testifies before the Senate Health and Education Committee. FedEx Corp. reports results and SpaceX is scheduled to launch a Falcon 9 rocket.
[h=2]What we've been reading[/h]This is what's caught our eye over the last 24 hours.
- No one can agree on where the stock market will be in six months.
- IRS says it will not extend tax filing deadline beyond July 15.
- New flood-risk data threatens to change millions of American home prices.
- Copper's comeback has room to roll on.
- Suitcases of cash halted by virus in EU money-laundering hotspot.
- Torture, terror, and revenge in battle over fabled Irish company.
- The anthropause: How the pandemic gives scientists a new way to study wildlife.

But it turns out this isn't a V at all. The key reason is that these regional Fed surveys, or PMIs, or ISMs (they're all similar) aren't measuring some absolute level of activity. They're measuring how the panelists' businesses are doing relative to the month before. So you'll notice that the Dallas Fed chart above shows a reading of -6.1. Because it's below 0 that means respondents on net actually said business was worse than it was in the prior month.
Here's the same data as above, but presented as a bar chart, which makes the situation even more clear. As you can see, manufacturers in Texas have now reported four straight months of the situation being worse than it was in the month before. Yes, the pace at which it's getting worse is less severe, but it's still a sequential deterioration.

Anyway, all you have to do is take one look at the actual survey, and you'll see there's no V. The employment situation is getting worse. More manufacturers are still laying off workers than expanding payrolls. Only 29% of survey respondents see a better economic future than they saw the previous month. Business uncertainty is still growing. And if you read the anecdotal comments, there's already some talk from companies about how the latest rise in Texas virus cases is an economic concern. Bottom line: there are a lot of charts that look like a V, but in reality they don't show anything close to a snapback to normal.
World Acceptance.
WRLD. Price...65.82
This is a shit company who got a reprieve during the Trump presidency with the abandonment of many regulations against short term lenders (predatory)
Analysts hate it, I think it's worth watching.


Storage Wars
No, this piece is not about the reality TV show that has a gruff lot of hopeful entrepreneurs blindly bidding for the contents of abandoned storage lockers.With hyper-accelerating technology creating data at an exponential rate, it is getting far too big to physically store.
In 2018, over $80 billion was spent on data centers across the country, often in the remotest areas imaginable. Bend, OR, rural West Virginia, or dusty, sun-baked Sparks, NV, yes, they’re all there.
And you know what the biggest headache for the management of many tech companies is today? A severe shortage of cost-effective data storage and the skyrocketing electric power bills to power them.
During my lifetime, storage has evolved from one-inch magnetic tape on huge reels to highly unreliable 5 ¼ inch floppy disks, then 3-inch discs, and later to compact discs.
The solid-state storage on silicon chips that hit the market six years ago was a dream, as it was cheap, highly portable, and lightning-fast. Boot up time shrank from minutes to seconds. The only problem was the heat and sitting on it when you forgot those ultra-slim designs on the sofa.
Moore’s Law, which has storage doubling every 18 months while the cost halves, has proved faithful to the bitter end. The problem now is, the end is near, as the size of an electron becoming too big to pass through a gate increasingly a limiting factor.
As of 2017, the world needed 44 gigabytes of storage per day. According to the International Data Corporation, that figure will explode to 460 billion gigabytes by 2025, in a mere seven years.
That’s when the global datasphere will reach 160 trillion gigabytes, or 160 zettabytes. It all sounds like something out of an Isaac Asimov science fiction novel.
You can double that figure again when Google’s Project Loon brings the planet’s 5 million residents currently missing from the Internet online.
In the meantime, companies are making fortunes on the build-out. Some $50 billion has to be spent this year just to keep even with burgeoning storage demand.
And guess what? Thanks to rocketing demand from electric cars and AI, memory-grade silicon is expected to run out by 2040.
All I can say is “Better pray for DNA.”
Deoxyribonucleic acid has long been the Holy Grail for data storage. There is no reason why it shouldn’t work. After all, you and I are the product of the most dynamic data storage system known to man.
All of the information needed to replicate ourselves is found in 3 trillion base pairs occupying every single cell in the human body.
To give you some idea of the immense scalability of DNA, consider this. One exabyte of data storage using convention silicon would weigh 320 metric tonnes. The same amount of information in DNA would occupy five cubic centimeters weighing five grams, or 0.18 ounce!
And here is the big advantage of DNA. Conventional silicon permits only two programming choices, “0” or “1”. Even with just that, we have been able to achieve incredible gains in computing over the last 50 years.
DNA is made of four different bases, adenine, cytosine, guanine, and thymine, which allow four squared possible combinations, or 16. The power demands are immeasurably small and it runs cool.
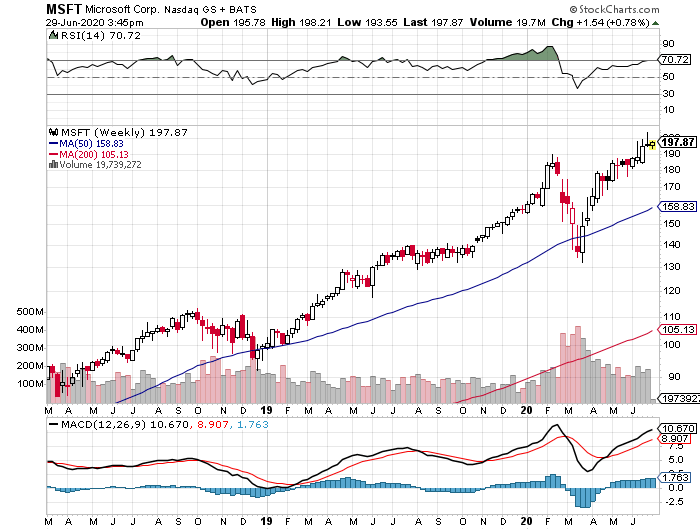
Also known as NAM, or nucleic acid memory, it has already burst out of the realm of science fiction. Microsoft Research (MSFT), the University of Washington, and (IBM) have all gotten it to work on a limited basis.
So far, retrieval is the biggest problem, something we ourselves do trillions of time a day every day without thinking about it.
DNA is organic, requires no silicon, and can replicate itself into infinity at zero cost. The information can last tens of thousands of years. Indeed, scientists were recently able to reconstruct the DNA from Neanderthals who lived in caves in Spain 27,000 years ago.
Yes, you can now clone your own Neanderthal. Gardening work maybe? Low-waged assembly line workers? Soldiers? Traders? I think I already know some. Look for that tell-tale supraorbital brow (click here for details).
But I diverge.
If you want to make money, like tomorrow, instead of in a decade, there are still a few possibilities on the storage front.
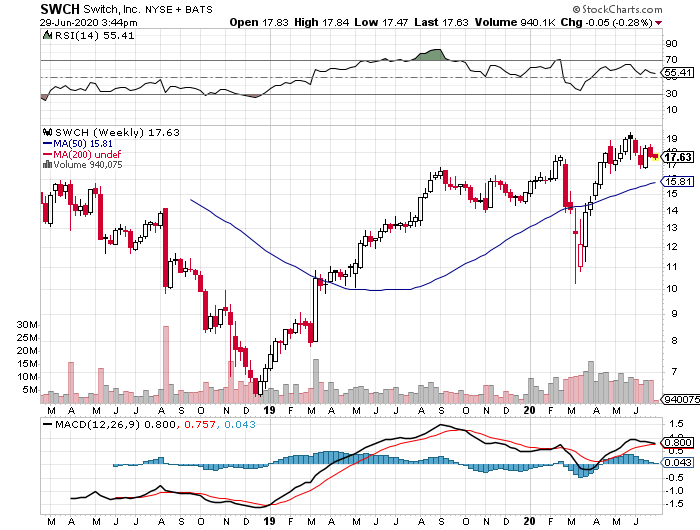
If you want to take a flyer on the ongoing data storage buildout, you might look at Las Vegas-based Switch (SWCH). The company IPO’d in October and has since seen its shares drop by 32%, which is normal for these small tech companies.
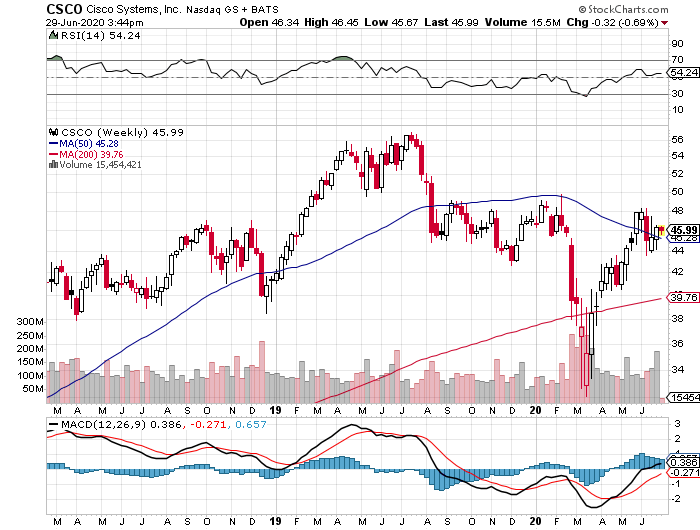
A much cleaner and safer play is Cisco Systems (CSCO), one of my favorite lagging old technology companies. After all, everyone needs Cisco routers on an industrial scale.

The Future of Computing
 Your Daughter’s Next Date?
WRLD. Price...65.82
This is a shit company who got a reprieve during the Trump presidency with the abandonment of many regulations against short term lenders (predatory)
Analysts hate it, I think it's worth watching.


Global Market Comments
June 30, 2020
Fiat LuxFeatured Trade:(STORAGE WARS),
(MSFT), (IBM), (CSCO), (SWCH),
(THE MAD HEDGE JUNE 4 TRADERS & INVESTORS SUMMIT RECORDING IS UP)

June 30, 2020
Fiat LuxFeatured Trade:(STORAGE WARS),
(MSFT), (IBM), (CSCO), (SWCH),
(THE MAD HEDGE JUNE 4 TRADERS & INVESTORS SUMMIT RECORDING IS UP)

Storage Wars
No, this piece is not about the reality TV show that has a gruff lot of hopeful entrepreneurs blindly bidding for the contents of abandoned storage lockers.With hyper-accelerating technology creating data at an exponential rate, it is getting far too big to physically store.
In 2018, over $80 billion was spent on data centers across the country, often in the remotest areas imaginable. Bend, OR, rural West Virginia, or dusty, sun-baked Sparks, NV, yes, they’re all there.
And you know what the biggest headache for the management of many tech companies is today? A severe shortage of cost-effective data storage and the skyrocketing electric power bills to power them.
During my lifetime, storage has evolved from one-inch magnetic tape on huge reels to highly unreliable 5 ¼ inch floppy disks, then 3-inch discs, and later to compact discs.
The solid-state storage on silicon chips that hit the market six years ago was a dream, as it was cheap, highly portable, and lightning-fast. Boot up time shrank from minutes to seconds. The only problem was the heat and sitting on it when you forgot those ultra-slim designs on the sofa.
Moore’s Law, which has storage doubling every 18 months while the cost halves, has proved faithful to the bitter end. The problem now is, the end is near, as the size of an electron becoming too big to pass through a gate increasingly a limiting factor.
As of 2017, the world needed 44 gigabytes of storage per day. According to the International Data Corporation, that figure will explode to 460 billion gigabytes by 2025, in a mere seven years.
That’s when the global datasphere will reach 160 trillion gigabytes, or 160 zettabytes. It all sounds like something out of an Isaac Asimov science fiction novel.
You can double that figure again when Google’s Project Loon brings the planet’s 5 million residents currently missing from the Internet online.
In the meantime, companies are making fortunes on the build-out. Some $50 billion has to be spent this year just to keep even with burgeoning storage demand.
And guess what? Thanks to rocketing demand from electric cars and AI, memory-grade silicon is expected to run out by 2040.
All I can say is “Better pray for DNA.”
Deoxyribonucleic acid has long been the Holy Grail for data storage. There is no reason why it shouldn’t work. After all, you and I are the product of the most dynamic data storage system known to man.
All of the information needed to replicate ourselves is found in 3 trillion base pairs occupying every single cell in the human body.
To give you some idea of the immense scalability of DNA, consider this. One exabyte of data storage using convention silicon would weigh 320 metric tonnes. The same amount of information in DNA would occupy five cubic centimeters weighing five grams, or 0.18 ounce!
And here is the big advantage of DNA. Conventional silicon permits only two programming choices, “0” or “1”. Even with just that, we have been able to achieve incredible gains in computing over the last 50 years.
DNA is made of four different bases, adenine, cytosine, guanine, and thymine, which allow four squared possible combinations, or 16. The power demands are immeasurably small and it runs cool.
Also known as NAM, or nucleic acid memory, it has already burst out of the realm of science fiction. Microsoft Research (MSFT), the University of Washington, and (IBM) have all gotten it to work on a limited basis.
So far, retrieval is the biggest problem, something we ourselves do trillions of time a day every day without thinking about it.
DNA is organic, requires no silicon, and can replicate itself into infinity at zero cost. The information can last tens of thousands of years. Indeed, scientists were recently able to reconstruct the DNA from Neanderthals who lived in caves in Spain 27,000 years ago.
Yes, you can now clone your own Neanderthal. Gardening work maybe? Low-waged assembly line workers? Soldiers? Traders? I think I already know some. Look for that tell-tale supraorbital brow (click here for details).
But I diverge.
If you want to make money, like tomorrow, instead of in a decade, there are still a few possibilities on the storage front.
If you want to take a flyer on the ongoing data storage buildout, you might look at Las Vegas-based Switch (SWCH). The company IPO’d in October and has since seen its shares drop by 32%, which is normal for these small tech companies.
A much cleaner and safer play is Cisco Systems (CSCO), one of my favorite lagging old technology companies. After all, everyone needs Cisco routers on an industrial scale.


The Future of Computing

Very rare..


CORRECTING THE EMAIL SUBJECT LINE: GLD (not TSLA)
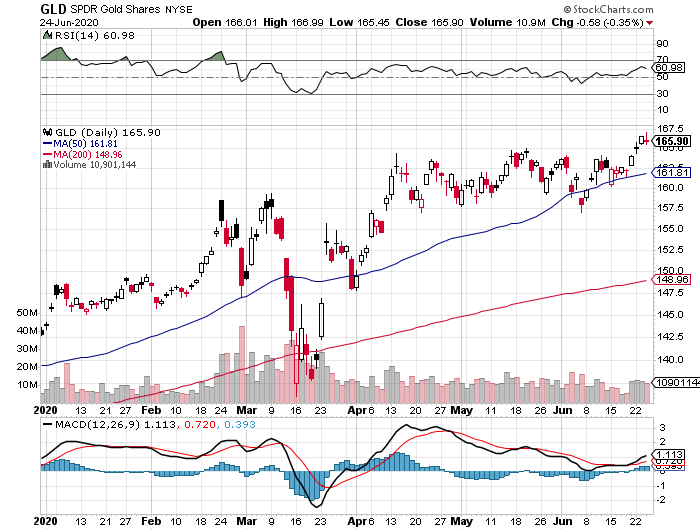
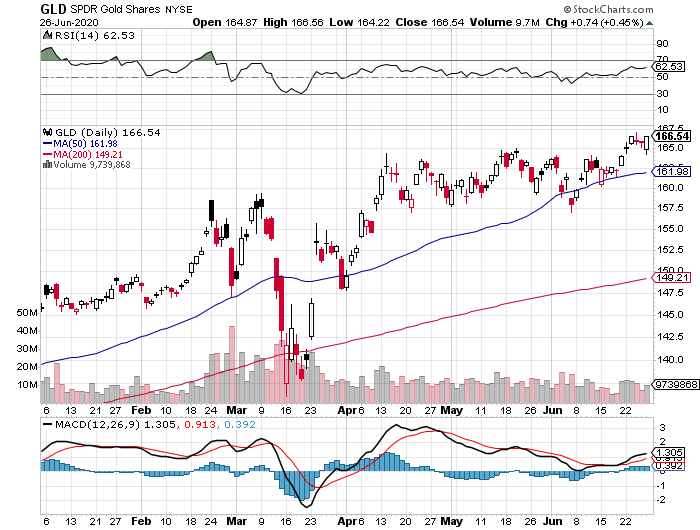
Buy the SPDR Gold Shares ETF (GLD) July 2020 $158-$161 in-the-money vertical BULL CALL spread at $2.60 or best
Opening Trade
6-30-2020
expiration date: July 17, 2020
Portfolio weighting: 10%
Number of Contracts = 38 contracts
In view of last week’s market action, I am going to double up my long position in gold.
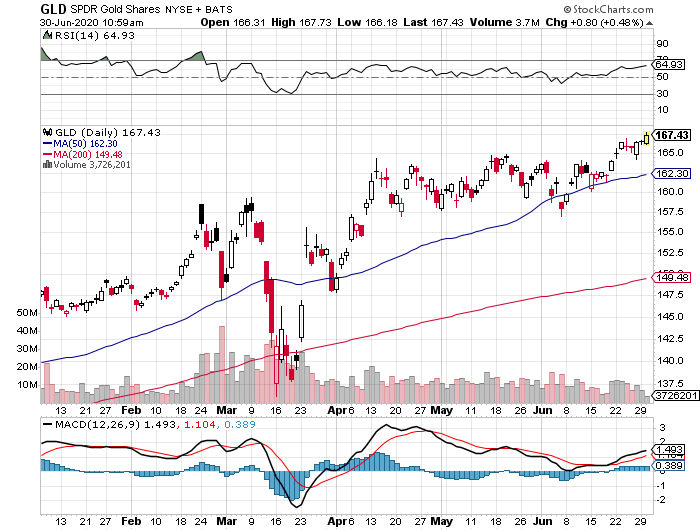
With the government printing money like there is no tomorrow (and there might not be), gold has become the darling hedge of the investment community. In addition, central banks have been buying it hand over fist, fleeing a US weakening dollar.
And with all this free stimulus money being spread about, inflation will eventually rear its ugly head. When gold breaks through its old all-time high for the first time in nine years, it will go ballistic.
To read the full report on why gold is going to new highs, see below.
I am therefore buying the SPDR Gold Shares ETF (GLD) July 2020 $158-$161 in-the-money vertical BULL CALL spread at $2.60 or best.
Don’t pay more than $2.75 or the risk/reward will tip against you.
I’m a bit tight on the strike prices here, but we have only 12 days to expiration, including one three-day weekend.
This is a bet that (GLD) ETF won’t fall below $161.00 by the July 17 expiration date in 12 trading days.
DO NOT USE MARKET ORDERS UNDER ANY CIRCUMSTANCES.
Simply enter your limit order, wait five minutes, and if you don’t get done, cancel your order and increase your bid by five cents with a second order.
Here are the specific trades you need to execute this position:
Buy 38 July 2020 (GLD) $158 calls at…………..................………$9.25
Sell short 38 July 2020 (GLD) $161 calls at..……................…….$6.65
Net Cost:…………………………………………...................….….....$2.60
Potential Profit: $3.00 - $2.60 = $0.40
(38 X 100 X $0.40) = $1,520 or 15.38% in 12 trading days.
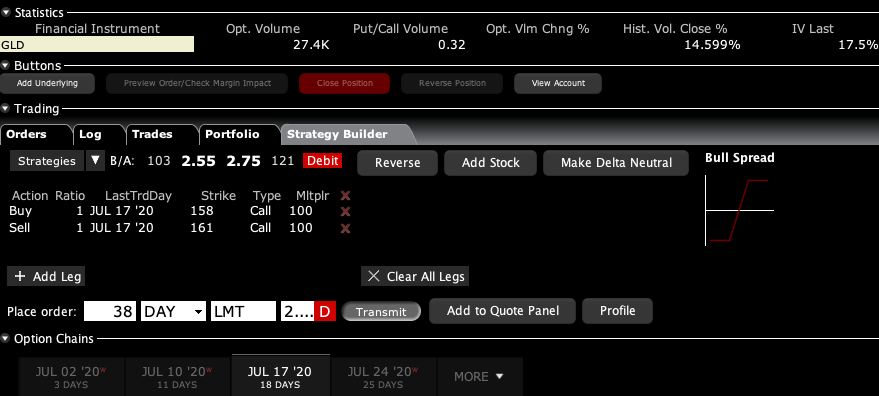
To see how to enter this trade in your online platform, please look at the order ticket above, which I pulled off of Interactive Brokers.
If you are uncertain on how to execute an options spread, please watch my training video by clicking here.
The best execution can be had by placing your bid for the entire spread in the middle market and waiting for the market to come to you. The difference between the bid and the offer on these deep in-the-money spread trades can be enormous.
Don’t execute the legs individually or you will end up losing much of your profit. Spread pricing can be very volatile on expiration months farther out.
Keep in mind that these are ballpark prices at best. After the alerts go out, prices can be all over the map.
5 Reasons Gold is Going to a New High.
Gold has just broken out to a new nine-year high. And here’s the good news. It’s only just begun.
Cut US dollar interest rates to zero and print $14 trillion more and you render the greenback worthless.
Shunned as the pariah of the financial markets for years, the yellow metal has suddenly become everyone’s favorite hedge.
Now that gold is back in fashion, how high can it really go?
The question begs your rapt attention as the Coronavirus has suddenly unleashed a plethora of new positive fundamentals for the barbarous relic.
It turns out that gold is THE deflationary asset to own.
Who knew?
I was an unmitigated bear on the price of gold after it peaked in 2011. In recent years, the world has been obsessed with yields, chasing them down to historically low levels across all asset classes.
But now that much of the world already has, or is about to have negative interest rates, a bizarre new kind of mathematics applies to gold ownership.
Gold’s problem used to be that it yielded absolutely nothing, cost you money to store, and carried hefty transaction costs. That asset class didn’t fit anywhere in a yield-obsessed universe.
Now we have a horse of a different color.
Europeans wishing to put money in a bank have to pay for the privilege to do so. Place €1 million on deposit on an overnight account, and you will have only 996,000 Euros in a year. You just lost 40 basis points on your -0.40% negative interest rate.
With gold, you still earn zero, an extravagant return in this upside-down world. All of a sudden, zero is a win.
For the first time in human history, that gives you a 40-basis point yield advantage by gold over Euros. Similar numbers now apply to Japanese yen deposits as well.
As a result, the numbers are so compelling that it has sparked a new gold fever among hedge funds and European and Japanese individuals alike.
Websites purveying investment-grade coins and bars crashed multiple times last week, due to overwhelming demand (I occasionally have the same problem). Some retailers have run out of stock.
So I’ll take this opportunity to review a short history of the gold market (GLD) for the young and the uninformed.
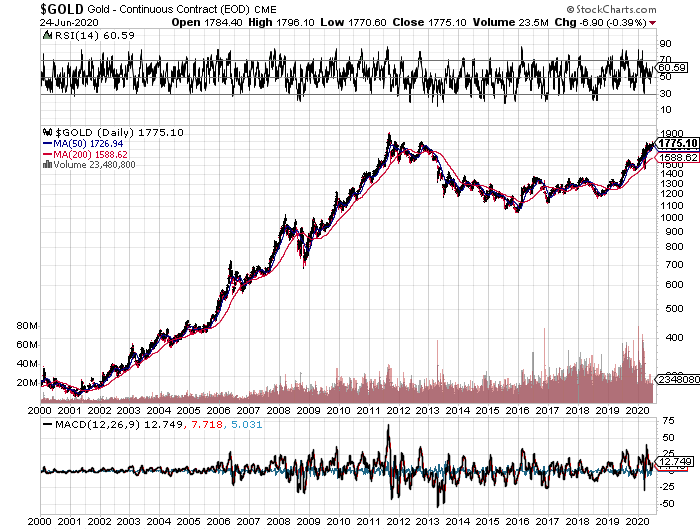
Since it last peaked in the summer of 2011 at $1,927 an ounce, the barbarous relic was beaten like the proverbial red-headed stepchild, dragging silver (SLV) down with it. It faced a perfect storm.
Gold was traditionally sought after as an inflation hedge. But with economic growth weak, wages stagnant, and much work still being outsourced abroad, deflation became rampant.
The biggest buyers of gold in the world, the Indians, have seen their purchasing power drop by half, thanks to the collapse of the rupee against the US dollar. The government increased taxes on gold in order to staunch precious capital outflows.
Chart gold against the Shanghai index, and the similarity is striking, until negative interest rates became widespread in 2016.
In the meantime, gold supply/demand balance was changing dramatically.
While no one was looking, the average price of gold production soared from $5 in 1920 to $1,400 today. Over the last 100 years, the price of producing gold has risen four times faster than the underlying metal.
It’s almost as if the gold mining industry is the only one in the world which sees real inflation since costs soared at a 15% annual rate for the past five years.
This is a function of what I call “peak gold.” They’re not making it anymore. Miners are increasingly being driven to higher risk, more expensive parts of the world to find the stuff.
You know those tires on heavy dump trucks? They now cost $200,000 each, and buyers face a three-year waiting list to buy one.
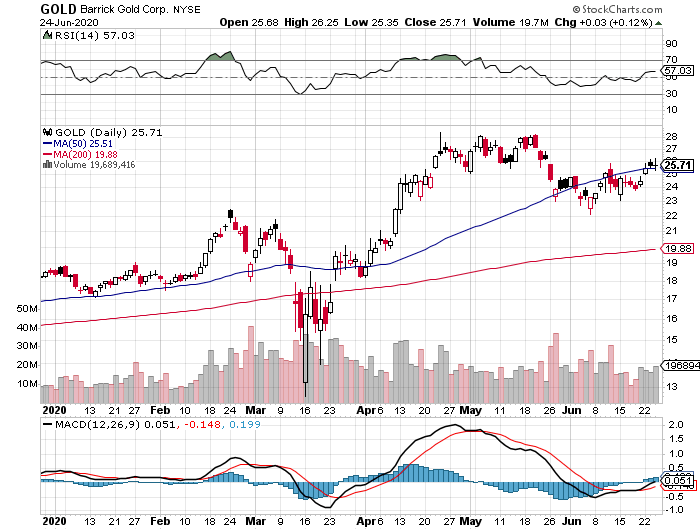
Barrick Gold (GOLD), the world’s largest gold miner, didn’t try to mine gold at 15,000 feet in the Andes, where freezing water is a major problem, because they like the fresh air.
What this means is that when the spot price of gold fell below the cost of production, miners simply shut down their most marginal facilities, drying up supply. That has recently been happening on a large scale.
Barrick Gold, a client of the Mad Hedge Fund Trader, can still operate as older mines carry costs that go all the way down to $600 an ounce.
No one is going to want to supply the sparkly stuff at a loss. So, supply disappeared.
I am constantly barraged with emails from gold bugs who passionately argue that their beloved metal is trading at a tiny fraction of its true value and that the barbaric relic is really worth $5,000, $10,000, or even $50,000 an ounce (GLD).
They claim the move in the yellow metal we are seeing now is only the beginning of a 30-fold rise in prices, similar to what we saw from 1972 to 1979 when it leaped from $32 to $950.
So, when the chart below popped up in my inbox showing the gold backing of the US monetary base, I felt obligated to pass it on to you to illustrate one of the intellectual arguments these people are using.
To match the gain seen since the 1936 monetary value peak of $35 an ounce, when the money supply was collapsing during the Great Depression and the double top in 1979 when gold futures first tickled $950, this precious metal has to increase in value by 800% from the recent $1,050 low. That would take our barbarous relic friend up to $8,400 an ounce.
To match the move from the $35/ounce, 1972 low to the $950/ounce, 1979 top in absolute dollar terms, we need to see another 27.14 times move to $28,497/ounce.
Have I gotten your attention yet?
I am long term bullish on gold, other precious metals, and virtually all commodities for that matter. But I am not that bullish. These figures make my own $2,300/ounce long-term prediction positively wimp-like by comparison.
The seven-year spike up in prices we saw in the seventies, which found me in a very long line in Johannesburg, South Africa to unload my own Krugerrands in 1979, was triggered by a number of one-off events that will never be repeated.
Some 40 years of unrequited demand was unleashed when Richard Nixon took the US off the gold standard and decriminalized private ownership in 1972. Inflation then peaked around 20%. Newly enriched sellers of oil had a strong historical affinity with gold.
South Africa, the world’s largest gold producer, was then a boycotted international pariah and teetering on the edge of disaster. We are nowhere near the same geopolitical neighborhood today, and hence, my more subdued forecast.
But then again, I could be wrong.
In the end, gold may have to wait for a return of real inflation to resume its push to new highs. The previous bear market in gold lasted 18 years, from 1980 to 1998, so don’t hold your breath.
What should we look for? The surprise that your friends get an out-of-the-blue pay increase, the largest component of the inflation calculation.
This is happening now in technology and is slowly tricking down to minimum wage workers. When I visit open houses in my neighborhood in San Francisco, half the visitors are thirty-somethings wearing hoodies offering to pay cash.
It could be a long wait for real inflation, possibly into the mid-2020s when shocking wage hikes spread elsewhere.
You may have noticed that I have been playing gold from the long side virtually every month since it bottomed in January. I’ll be back in there again, given a good low risk, high return entry point.
You’ll be the first to know when that happens.
As for the many investment advisor readers who have stayed long gold all along to hedge their clients' other risk assets, good for you.
You’re finally learning!


CORRECTING THE EMAIL SUBJECT LINE: GLD (not TSLA)
Buy the SPDR Gold Shares ETF (GLD) July 2020 $158-$161 in-the-money vertical BULL CALL spread at $2.60 or best
Opening Trade
6-30-2020
expiration date: July 17, 2020
Portfolio weighting: 10%
Number of Contracts = 38 contracts
In view of last week’s market action, I am going to double up my long position in gold.
With the government printing money like there is no tomorrow (and there might not be), gold has become the darling hedge of the investment community. In addition, central banks have been buying it hand over fist, fleeing a US weakening dollar.
And with all this free stimulus money being spread about, inflation will eventually rear its ugly head. When gold breaks through its old all-time high for the first time in nine years, it will go ballistic.
To read the full report on why gold is going to new highs, see below.
I am therefore buying the SPDR Gold Shares ETF (GLD) July 2020 $158-$161 in-the-money vertical BULL CALL spread at $2.60 or best.
Don’t pay more than $2.75 or the risk/reward will tip against you.
I’m a bit tight on the strike prices here, but we have only 12 days to expiration, including one three-day weekend.
This is a bet that (GLD) ETF won’t fall below $161.00 by the July 17 expiration date in 12 trading days.
DO NOT USE MARKET ORDERS UNDER ANY CIRCUMSTANCES.
Simply enter your limit order, wait five minutes, and if you don’t get done, cancel your order and increase your bid by five cents with a second order.
Here are the specific trades you need to execute this position:
Buy 38 July 2020 (GLD) $158 calls at…………..................………$9.25
Sell short 38 July 2020 (GLD) $161 calls at..……................…….$6.65
Net Cost:…………………………………………...................….….....$2.60
Potential Profit: $3.00 - $2.60 = $0.40
(38 X 100 X $0.40) = $1,520 or 15.38% in 12 trading days.


If you are uncertain on how to execute an options spread, please watch my training video by clicking here.
The best execution can be had by placing your bid for the entire spread in the middle market and waiting for the market to come to you. The difference between the bid and the offer on these deep in-the-money spread trades can be enormous.
Don’t execute the legs individually or you will end up losing much of your profit. Spread pricing can be very volatile on expiration months farther out.
Keep in mind that these are ballpark prices at best. After the alerts go out, prices can be all over the map.
5 Reasons Gold is Going to a New High.
Gold has just broken out to a new nine-year high. And here’s the good news. It’s only just begun.
Cut US dollar interest rates to zero and print $14 trillion more and you render the greenback worthless.
Shunned as the pariah of the financial markets for years, the yellow metal has suddenly become everyone’s favorite hedge.
Now that gold is back in fashion, how high can it really go?
The question begs your rapt attention as the Coronavirus has suddenly unleashed a plethora of new positive fundamentals for the barbarous relic.
It turns out that gold is THE deflationary asset to own.
Who knew?
I was an unmitigated bear on the price of gold after it peaked in 2011. In recent years, the world has been obsessed with yields, chasing them down to historically low levels across all asset classes.
But now that much of the world already has, or is about to have negative interest rates, a bizarre new kind of mathematics applies to gold ownership.
Gold’s problem used to be that it yielded absolutely nothing, cost you money to store, and carried hefty transaction costs. That asset class didn’t fit anywhere in a yield-obsessed universe.
Now we have a horse of a different color.
Europeans wishing to put money in a bank have to pay for the privilege to do so. Place €1 million on deposit on an overnight account, and you will have only 996,000 Euros in a year. You just lost 40 basis points on your -0.40% negative interest rate.
With gold, you still earn zero, an extravagant return in this upside-down world. All of a sudden, zero is a win.
For the first time in human history, that gives you a 40-basis point yield advantage by gold over Euros. Similar numbers now apply to Japanese yen deposits as well.
As a result, the numbers are so compelling that it has sparked a new gold fever among hedge funds and European and Japanese individuals alike.
Websites purveying investment-grade coins and bars crashed multiple times last week, due to overwhelming demand (I occasionally have the same problem). Some retailers have run out of stock.
So I’ll take this opportunity to review a short history of the gold market (GLD) for the young and the uninformed.
Since it last peaked in the summer of 2011 at $1,927 an ounce, the barbarous relic was beaten like the proverbial red-headed stepchild, dragging silver (SLV) down with it. It faced a perfect storm.
Gold was traditionally sought after as an inflation hedge. But with economic growth weak, wages stagnant, and much work still being outsourced abroad, deflation became rampant.
The biggest buyers of gold in the world, the Indians, have seen their purchasing power drop by half, thanks to the collapse of the rupee against the US dollar. The government increased taxes on gold in order to staunch precious capital outflows.
Chart gold against the Shanghai index, and the similarity is striking, until negative interest rates became widespread in 2016.
In the meantime, gold supply/demand balance was changing dramatically.
While no one was looking, the average price of gold production soared from $5 in 1920 to $1,400 today. Over the last 100 years, the price of producing gold has risen four times faster than the underlying metal.
It’s almost as if the gold mining industry is the only one in the world which sees real inflation since costs soared at a 15% annual rate for the past five years.
This is a function of what I call “peak gold.” They’re not making it anymore. Miners are increasingly being driven to higher risk, more expensive parts of the world to find the stuff.
You know those tires on heavy dump trucks? They now cost $200,000 each, and buyers face a three-year waiting list to buy one.
Barrick Gold (GOLD), the world’s largest gold miner, didn’t try to mine gold at 15,000 feet in the Andes, where freezing water is a major problem, because they like the fresh air.
What this means is that when the spot price of gold fell below the cost of production, miners simply shut down their most marginal facilities, drying up supply. That has recently been happening on a large scale.
Barrick Gold, a client of the Mad Hedge Fund Trader, can still operate as older mines carry costs that go all the way down to $600 an ounce.
No one is going to want to supply the sparkly stuff at a loss. So, supply disappeared.
I am constantly barraged with emails from gold bugs who passionately argue that their beloved metal is trading at a tiny fraction of its true value and that the barbaric relic is really worth $5,000, $10,000, or even $50,000 an ounce (GLD).
They claim the move in the yellow metal we are seeing now is only the beginning of a 30-fold rise in prices, similar to what we saw from 1972 to 1979 when it leaped from $32 to $950.
So, when the chart below popped up in my inbox showing the gold backing of the US monetary base, I felt obligated to pass it on to you to illustrate one of the intellectual arguments these people are using.
To match the gain seen since the 1936 monetary value peak of $35 an ounce, when the money supply was collapsing during the Great Depression and the double top in 1979 when gold futures first tickled $950, this precious metal has to increase in value by 800% from the recent $1,050 low. That would take our barbarous relic friend up to $8,400 an ounce.
To match the move from the $35/ounce, 1972 low to the $950/ounce, 1979 top in absolute dollar terms, we need to see another 27.14 times move to $28,497/ounce.
Have I gotten your attention yet?
I am long term bullish on gold, other precious metals, and virtually all commodities for that matter. But I am not that bullish. These figures make my own $2,300/ounce long-term prediction positively wimp-like by comparison.
The seven-year spike up in prices we saw in the seventies, which found me in a very long line in Johannesburg, South Africa to unload my own Krugerrands in 1979, was triggered by a number of one-off events that will never be repeated.
Some 40 years of unrequited demand was unleashed when Richard Nixon took the US off the gold standard and decriminalized private ownership in 1972. Inflation then peaked around 20%. Newly enriched sellers of oil had a strong historical affinity with gold.
South Africa, the world’s largest gold producer, was then a boycotted international pariah and teetering on the edge of disaster. We are nowhere near the same geopolitical neighborhood today, and hence, my more subdued forecast.
But then again, I could be wrong.
In the end, gold may have to wait for a return of real inflation to resume its push to new highs. The previous bear market in gold lasted 18 years, from 1980 to 1998, so don’t hold your breath.
What should we look for? The surprise that your friends get an out-of-the-blue pay increase, the largest component of the inflation calculation.
This is happening now in technology and is slowly tricking down to minimum wage workers. When I visit open houses in my neighborhood in San Francisco, half the visitors are thirty-somethings wearing hoodies offering to pay cash.
It could be a long wait for real inflation, possibly into the mid-2020s when shocking wage hikes spread elsewhere.
You may have noticed that I have been playing gold from the long side virtually every month since it bottomed in January. I’ll be back in there again, given a good low risk, high return entry point.
You’ll be the first to know when that happens.
As for the many investment advisor readers who have stayed long gold all along to hedge their clients' other risk assets, good for you.
You’re finally learning!


